Skip to content
Get App

Structure Shift vs Liquidity Grab - ICT Concepts

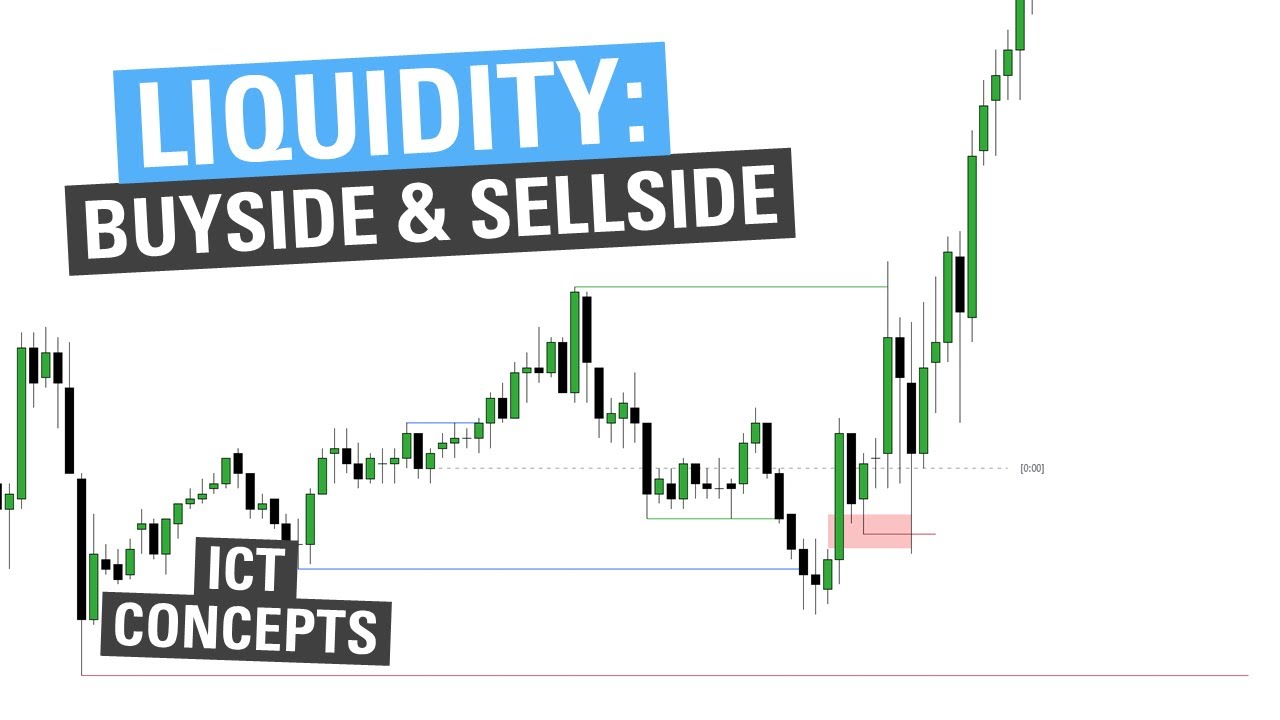
TTrades explains how to read displacement and the lack of displacement over market structure, using ICT concepts to anticipate liquidity grabs, breakers, and broadening formations in intraday price ac

Key Takeaways

  • Displacement over structure is the primary signal of trend direction and intent.
  • Lack of displacement after taking liquidity often indicates a reversal or a continuation against the initial move.
  • Broadening formations and Power of Three patterns can explain failed range breaks and subsequent distribution.
  • Confirmation can come from aligning breakers, fair value gaps, and SMT divergences at points of interest.

What the video covers

  • Displacement is defined as large, aggressive candles closing near the high or low that break market structure.
  • The lack of displacement, where price takes liquidity but fails to aggressively break through, is presented as a signal that price will likely reverse or continue in the opposite direction.
  • The video demonstrates the concept using a live session from the RTH open, starting with a take of the previous day's high.
  • Failure to displace below a short-term low is interpreted as a bullish sign, implying higher prices.
  • Aggressive displacement below a higher-timeframe low marks a shift from the buy side to the sell side of the curve.
  • Smart Money Technique (SMT) divergence with MQ is used as confirmation at key points.
  • Broadening formations and Power of Three (consolidation, manipulation, distribution) are used to explain failed range breaks followed by moves to the other side.
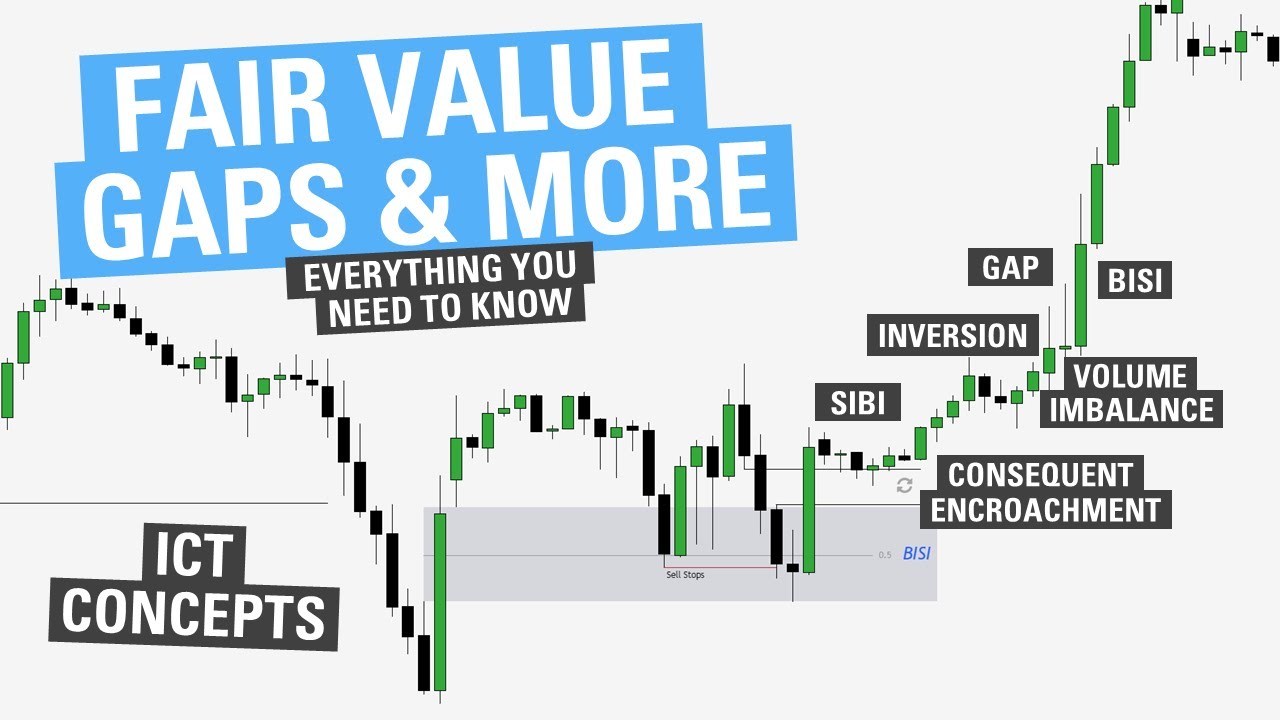
  • A breaker and fair value gap aligning at a point of interest is highlighted as a potential short entry.
  • The presenter emphasizes that when price struggles to reach back into a fair value gap, continuation in the trend direction is likely.
  • The method is framed as a complement to ICT mentorship teaching on displacement rather than a replacement for it.

Answers

Questions about this video

What does the presenter mean by displacement?

Displacement is described as large, aggressive candles that close near the high or low and break through market structure. The presenter says it is most meaningful when it occurs over structure.

How is the lack of displacement used as a trading signal?

When price takes a high or low but fails to aggressively break through or back in the opposite direction, the presenter reads this as a sign that price will likely move the other way. Examples include failing to displace below a short-term low, which suggests continuation higher.

What role do broadening formations play in this video?

The presenter links failed breaks of one side of a range to broadening formations and the Power of Three model. A failed side is expected to be followed by a move to the opposite side, creating a consolidation, manipulation, and distribution sequence.

Full Transcript — Download SRT & Markdown

00:01
Speaker A
Hey, how's it going everyone? This video is going to be over displacement and the lack of displacement. ICT's mentorship teaches you to focus on displacement, but a lot of people don't realize what you can take out of the lack of displacement.
00:20
Speaker A
so for those of you that don't know displacement is just large aggressive candles with closes in the high or the low such as here right displacement candle but you want to see it over structure so if you notice these aggressive candles
00:34
Speaker A
So for those of you that don't know, displacement is just large, aggressive candles with closes in the high or the low, such as here, right? Displacement candle. But you want to see it over structure. So if you notice these aggressive candles break structure up, that is displacement over structure. The lack of displacement is, if for example you take this low, you can see if you want to see displacement, you want to see aggressive moves and closes below. You can see if we move below, immediately back into the range. Another example: here, if you're going to displace below this low, you want to see large, aggressive candles down. You have the failure to displace down, you come back in.
00:48
Speaker A
move below immediately back into the range another example here if you're going to displace below this low you want to see large aggressive candles down you have the failure to displace down you come back in so for example
01:01
Speaker A
So for example, we're going to go to today's range. In today's price action, we're going to watch from RTH open essentially. And so you notice we have previous day's high right here, and we take it, right? And you can see we're not really displacing over this high, but we do have RTH open coming up. So the one thing you want to notice is, after we take this liquidity, are we going to aggressively break below and look for shorts, or are we going to fail to break below and continue higher? So if you notice, we put in this little low here. Do we displace below it? You can see right there we fail to displace even below this short-term low. That means we're likely to go higher, to the size once again available to displace below this low, and then we go higher.
01:14
Speaker A
this high but we do have rth open coming up so the one thing you want to notice is after we take this liquidity are we going to aggressively break below and look for shorts are we going to fail to
01:24
Speaker A
So now that we're here, right, we're reaching into RTH open and we want to see what happens. Okay, aggressive price action down. We break this little low here. I prefer to wait for a higher time frame low to be broken, and there's our displacement down. So now we're going from the buy side of the curve to the sell side of the curve. So now what you want to focus on is, when we put in lows, do we continue to displace below them and continue our bearish trend, or are we going to break above highs? So we'll watch. You can see right here we put in this little tiny loop, aggressively wrote below it. That means we're going to continue lower. Another low aggressively broken below, continue lower. Okay, here's a low, and then now we put in a high. If we're going to be bearish, we want to break through this aggressively. Bullish, we want to come back up and break through this aggressively. The lack of to do so on each side leans in the other direction.
01:41
Speaker A
the size once again available to this place below this low and then we go higher so now that we're here right we're reaching into rth open and we want to see what happens okay aggressive price action down we
01:56
Speaker A
What do I mean by that? See how we break below this but come right back into the range, not really the displacement you want to see. You can see big closes below, big closes below. So watching this, you can see right here that little low as well broke through and failed to displace, and I'll actually put in an SMT with MQ. Now what we want to watch is, are we going to go up here and fail to displace over this high and come back down, or are we going to get displacement above it? So watching this, we get aggressive candles that displace over it. So now we're on the buy side of the curve. So now what you want to look for is, our high is going to be continued to displace over aggressively, or our lows are going to be displaced over aggressively, or the lack of each. Watching this, we put in a high, and we put in a low here. So we want to watch, is forms right? Okay, didn't break over this aggressively, so we're likely to go a little bit lower here. Do we break below this aggressively? Okay, not very aggressive. You can see broke, come right back into the range, and what does that mean? Well, it's the same thing as a broadening formation, power of three. Let me explain. You fail one side of the range, you want to see the other side of the range. That's your broad formation, or your power of three, right? Consolidation, manipulation, then you'd want to get your distribution. So you can see we distribute up. So taking that off, we now have the slope, and you can see this high was broken through aggressively. So we're likely to continue higher, put in a new high. If we're going to continue the trend up, we will have to break through that aggressively, and wherever our low comes in, do we displace through this aggressively? No, right? We continue higher.
02:11
Speaker A
want to focus on is when we put in lows do we continue to displace below them and continue our bearish trimmed or are we going to break above highs so we'll watch you can see right here we put in this
02:23
Speaker A
Now you notice we took this previous high from the morning. What do you want to look for? You want to look to see if we put in a short-term low and aggressively break below it. Let's see, there's a little low. We broke through this, but where we ran to a fair value gap, not very aggressive, comes right back into the range. When you do this, you're likely to see a new high there. There you go, break through aggressively. Now if this was to sustain, right, you'd think we want to go higher, but what happens? We immediately, aggressively move back in. So on a lower time frame, that's your BPR. And if you look now, where do we want to go? We want to break through this low, because that's our intermediate-term low. If we're going to continue lower, buy side of the curve here. If we go to the sell side, we want to break through this aggressively. If you look, retest that previous high, this is kind of your box setup if you've seen that. And there you go, aggressive displacement. You can see how these candles close below this structure, versus here, you can see one close immediately back into the range.
02:41
Speaker A
through this aggressively bullish we want to come back up and break through this aggressively the lack of to do so on each side leans in the other direction what do I mean by that is see how we break below this but come
02:54
Speaker A
So now what do you want to look for? This little fair value you have here also lines up with that breaker. That could be your short entry, and you can see right at this point of interest, see how we're not displacing back through this range and into this fair value gap? We're struggling to reach into this. That is a good sign that we're likely to go lower, continue lower. Now we put in this high. What you want to see is, again, we just place over this. If not, we want to see aggressive move below here to continue the bearish trend. So when you see this, broadening formation, likely to go take a high, and you can see, did it really displace over this? Either likely to see the other side of the range, broadening formation, aggressive move lower, and you can keep continuing this. So right here we're going to break above this. We want to see aggressive displacement. If not, we want to see aggressive move lower to continue. There you go, aggressive move lower, and you keep continuing this.
03:08
Speaker A
displace and I'll actually put in an smt with mq now what we want to watch is are we going to go up here and fail to displace over this high and come back down are we going to get
03:21
Speaker A
I hope this walkthrough showed you what to look for in terms of displacement or lack of displacement. I'd say the most important things to look for: if you're trying to get into a trend on the buy side of the curve, you want to see lows taken without displacement, and that can give you entries to get long. Then, when you're on the sell side of the curve, when you fail to displace over highs, that can be your short entries. Go back and look into your charts and just go back-test this. When you're in a bullish trend or want price to go in one direction, what happens when you fail to displace lower? Look at those as your long entries. I hope this video helps. If it did, please consider liking and subscribing. Hope you have a great day. See ya!
03:33
Speaker A
to displace over aggressively or our lows going to be displaced over aggressively or the lack of each watching this we put in a high and we put in a low here so we want to watch is forms right okay didn't break over this
03:50
Speaker A
aggressively so we're likely to go a little bit lower here do we break below this aggressively okay not very aggressive you can see broke come right back into the wrench and what does that mean well it's the same thing as a broadding formation
04:07
Speaker A
power of three let me explain you fail one side of the range you want to see the other side of the range that's your broad information or your power of three right consolidation manipulation then you'd want to get your
04:20
Speaker A
distribution so you can see we distribute up so taking that off we now have the slope and you can see this high was broken through aggressively right so we're likely to continue higher put in a new high if we're going to
04:39
Speaker A
continue the trend up we will have to break through that aggressively and wherever our low comes in do we displace through this aggressively no right we continue higher now you notice we took this previous hide from the morning
04:55
Speaker A
what do you want to look for you want to look to see if we put in a short term low and aggressively break below it let's see there's a little low we broke through this but where we ran to a fair value Gap not very
05:11
Speaker A
aggressive comes right back into the range when you do this you're likely to see a new high there you go break through aggressively now if this was to sustain right you'd think we want to go higher but what
05:26
Speaker A
happens we immediately aggressively move back in so on a lower time frame that's your BPR and if you look now where do we want to go we want to break through this low because that's our intermediate term low
05:39
Speaker A
if we're going to continue lower by side of the curve here if we go to the cell side we want to break through this aggressively if you look retest that previous high this is kind of your box setup if you've seen that
05:54
Speaker A
and there you go aggressive displacement you can see how these candles close below this structure versus here you can see one close immediately back into the range so now what do you want to look for this little fair value you have here
06:07
Speaker A
it also lines up with that breaker that could be your short entry and you can see right this point of Interest see how we're not displacing back through this range and into this fair value Gap we're struggling to reach into this that is a
06:24
Speaker A
good sign that we're likely to go lower continue lower now we put in this height what you want to see is again we just place over this if not we want to see aggressive move below here right to
06:42
Speaker A
continue the bearish trend do anything so when you see this right broad information likely to go take a high and you can see damn really displaced over this either likely to see the other side of the range broad information aggressive move
07:00
Speaker A
lower and you can keep continuing this so right here we're going to break above this we want to see aggressive displacement if not we want to see aggressive move lower to continue there you go aggressive move lower and you keep continuing this I hope this
07:16
Speaker A
walkthrough kind of showed you what to look for in terms of displacement or lack of displacement I'd say the most most important things to look for is if you're trying to get into a trend on a buy side of the curve you want to see
07:26
Speaker A
lows taken without displacement and that can give you entries to get long and then when you're on the sell side of the curve when you fail to displace over highs that can be your short entries right go back and look into your charts and just
07:41
Speaker A
go back test this when you're in a bullish Trend or want price to go in One Direction what happens when you fail to displace lower look at those as your long entries hope this video helps if it did please consider liking and
07:52
Speaker A
subscribing hope you have a great day see ya
Topics:ICTdisplacementliquidity grabmarket structurebreakerfair value gappower of threebroadening formationSMT divergenceRTH open

Get More with the SozAI App

Transcribe recordings, audio files, and YouTube videos — with AI summaries and speaker detection. 30 minutes free.

Or transcribe another YouTube video here →