Skip to content
Get App

Internal & External Liquidity Model - ICT Concepts

A trading tutorial building a model on ICT internal and external liquidity: fair value gaps as internal liquidity, swing highs/lows as external liquidity, and a 2R setup on NQ.

Key Takeaways

  • Fair value gaps act as internal liquidity that price tends to revisit before moving to external liquidity.
  • Swing highs and lows serve as external liquidity targets.
  • A top-down model (higher timeframe draw, lower timeframe confirmation, kill zone timing) can frame trades with a fixed 2R target.
  • Stop placement and runner management significantly affect outcomes in this model.

What the video covers

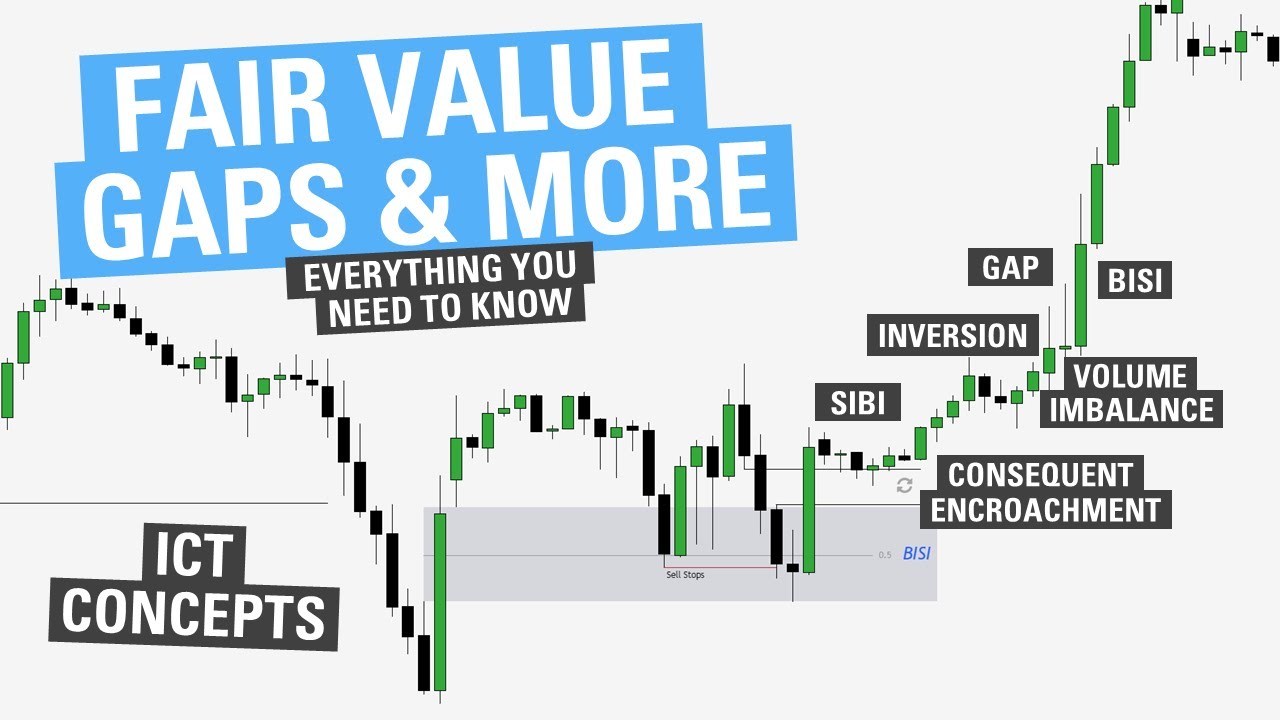
  • Defines internal liquidity as a fair value gap, a three-candle pattern where the first and third candle wicks do not overlap, signaling aggressive price movement.
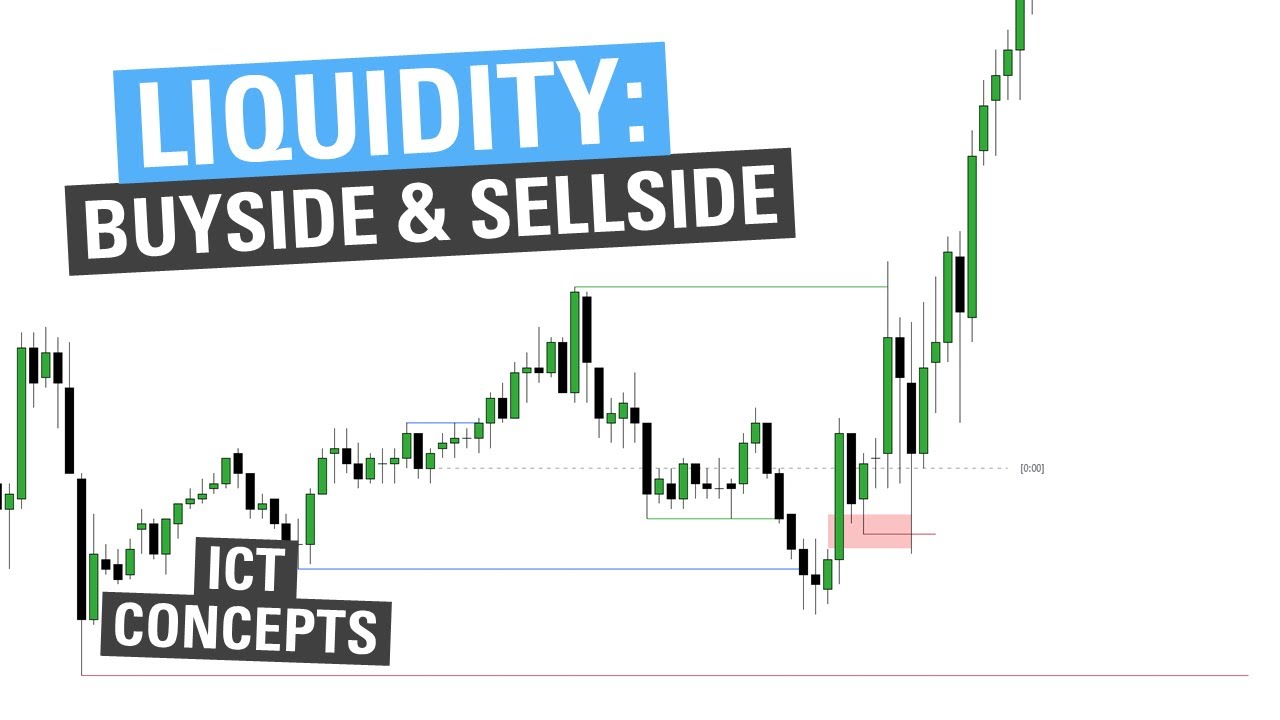
  • Defines external liquidity as swing highs and lows (buy-side and sell-side liquidity).
  • Explains that after price sweeps external liquidity without displacing through it, price tends to return to internal liquidity (the fair value gap) before targeting external liquidity again.
  • Presents a model: use a higher timeframe to identify internal or external liquidity, drop to a lower timeframe to confirm a kill zone, stop raid, market structure shift, and fair value gap entry, targeting 2R.
  • Walks through NQ daily and hourly chart examples, identifying a daily fair value gap as drawn liquidity.
  • Demonstrates a 5-minute chart entry at a fair value gap with a stop below the candle low, targeting 2R at prior highs.
  • Discusses managing runners: moving stops to break even may stop out before a larger target, while holding to the original stop could also work.
  • Compares alternative stop placements, such as a more conservative stop above the fair value gap candle high.
  • Covers additional examples, including waiting for kill zone entries and using inversions and discount/premium of ranges to frame trades.

Answers

Questions about this video

What does the video define as internal liquidity?

Internal liquidity is defined as a fair value gap, a three-candle pattern where the wicks of the first and third candles do not overlap. This indicates aggressive price action through that area.

What is the basic trading model presented?

The model uses a higher timeframe to identify liquidity targets, drops to a lower timeframe to confirm a kill zone, stop raid, market structure shift, and fair value gap, and targets 2R.

How does the video suggest managing runners after hitting the target?

The presenter notes that moving the stop to break even on runners could result in being stopped out before reaching a larger target, while holding the full position with the original stop could also work out. For this model, the focus is on catching 2R.

Full Transcript — Download SRT & Markdown

00:05
Speaker A
how's it going everyone? This video is going to be about building a model based off of internal and external liquidity concepts. Now, if you don't know what internal and external liquidity is, please go ahead and check out the video linked in the top right before watching this video. For those of you that do, we will go ahead and hop into a PDF, quickly review, and then talk about the model. So let's get started.
00:22
Speaker A
linked in the top right before watching this video for those of you that do we will go ahead and hop into a PDF quickly review and then talk about the model so let's get started now the first thing
00:33
Speaker A
Now, the first thing you need to understand is what internal liquidity is. Internal liquidity is just a fair value gap. Now, if you don't know what a fair value gap is, we will quickly review that, but I also have a video on that as well. It is just a three-candlestick pattern, one, two, three, in which the wick of the first candle and the wick of the third candle do not overlap, showing aggressive price action through this area. So you can see one, two, three: these candles do not overlap.
00:44
Speaker A
Candlestick pattern 1 2 3 in which the wick of the first candle and the wick of the third candle do not overlap showing aggressive price action through this area so you can see 1 2 3 these candles do not overlap now the next thing to
01:01
Speaker A
Now, the next thing to understand is what external liquidity is. External liquidity is simply highs and lows. So you can see here we have a range. We have a swing high here. We have a high with a lower high on each side, creating a high. So that is external liquidity. Similarly, down here, we have a low with a higher low on each side, creating a swing low. So this is external liquidity, or sell-side liquidity and buy-side liquidity.
01:14
Speaker A
a high so that is external liquidity similarly down here we have a low with a higher low on each side creating a swing low so this is external liquidity or sell-side liquidity and buy side liquidity now the next thing we're going
01:29
Speaker A
Now, the next thing we're going to cover is the relationship between the two. But since price swept external liquidity and could not displace through it, external liquidity is likely to reach back to internal liquidity. Now, when price reaches internal liquidity, it's respecting the fair value gap, and you can see this closure here. Where do we expect it to go? External liquidity. So you can see price moves from external to internal and back to external.
01:45
Speaker A
can see this closure here where do we expect it to go external liquidity so you can see price moves from external to internal and back to external so now let's take a look at the actual model so this model is just going to use a higher
02:00
Speaker A
So now let's take a look at the actual model. This model is just going to use a higher time frame level. Dropping down a time frame, I will look for internal or external liquidity. Then, on the lower time frame, I will look to make sure I'm in a kill zone. I have a stop raid, a market structure shift, a fair value gap, and then I will target two R.
02:13
Speaker A
and then I will Target to R so for an example of this when we swept this external low and looking for price to trade to internal then on the lower time frame we get a market structure shift a
02:25
Speaker A
For an example of this, when we swept this external low and are looking for price to trade to internal, then on the lower time frame we get a market structure shift, a fair value gap, and we target two R on the way to this fair value gap.
02:36
Speaker A
that we took this low right here now with this super aggressive close down here I'm not expecting a retracement right away so I'll let a few candles form now if we're going to mark this out we have a low with a higher low on each
02:51
Speaker A
Let's go ahead and hop into TradingView and go over a few examples of this. Here we are on the NQ daily chart, and you can see that we took this low right here. Now, with this super aggressive close down here, I'm not expecting a retracement right away, so I'll let a few candles form. If we're going to mark this out, we have a low with a higher low on each side, forming a swing low. Now let's see what the next candle does. We get aggressive displacement up, violating this fair value gap right here. So if I'm going to look for external to internal, I have a fair value gap resting right here, right around the discount of this range. Using that as my drawn liquidity, looking for price to draw to this higher time frame level, I'm going to drop down to the hourly chart.
03:10
Speaker A
right here right around discount of this range here so using that as my drawn liquidity or looking for price to draw to this higher time frame level I'm going to drop down to the hourly chart so zooming in here you can see here we
03:25
Speaker A
Zooming in here, you can see we have a candle where this wick does not overlap with this wick, so it is a fair value gap. It is also the new day opening gap, so having this marked out is our fair value gap. Let's see, now that we have internal liquidity, if price reaches into it during a kill zone, can we frame a trade? Here we are going through London. Now that price has reached into this fair value gap, if it is going to continue to trend higher and form a swing low, I'd anticipate price going from internal to external liquidity.
03:38
Speaker A
have internal liquidity if price reaches into it during a Kill Zone can we frame a trade so here we are going through London so now that price reached into this fair value Gap if it is going to continue to Trend higher and this is
03:57
Speaker A
So now that we have our higher time frame draw, which is this daily fair value gap, and then dropping down a time frame, we have a move from internal to external liquidity. Let's drop down another time frame and see if we can find a setup. Down here on the 5-minute chart, you can see we reached down into the hourly fair value gap, and we come back up and shift market structure here. Now I'm looking for the fair value gap, and if you notice, we have a fair value gap here as well as a fair value gap here. Looking to take an entry, I'm going to take an entry at the start of this fair value gap, but I want to allow it to trade down into this fair value gap. I'll put my stop below this fair value gap's candle low, then I'll be looking to target two R, which you can see is just at these highs. Even though I could target 3.16 R with a total run to the fair value gap, I'm just going to be looking at two R, and I could hold the runners if I want to.
04:12
Speaker A
external liquidity let's drop down another time frame and see if we can find a setup so down here on the 5minute chart you can see we reached down into the hourly fair value Gap and we come back up and shift Market structure here
04:27
Speaker A
Letting this play out, let's see what happens. There we get tagged in, and we get a move higher towards these highs, completing the move from internal liquidity to external liquidity. Skipping ahead, you can see that after hitting our TP, if I had moved my stop to break even on the runners, they would have been stopped out before reaching the daily fair value gap. However, if I had held my whole position to the daily fair value gap, keeping my original stop, it would have worked out as well. But for this model, I'm just focused on catching two R.
04:38
Speaker A
this fair value Gap but I want to allow it to be able to trade down into this fair value Gap I'll put my stop on this fair value Gap candles low then I'll be looking to Target 2 R which you can see
04:50
Speaker A
Let's hop into the next example. Zooming back out to the hourly chart, you can see we have our daily fair value gap, which was just targeted in the previous example. So we have an important daily level. We just swept an hourly high, so that's external liquidity. Do we have internal liquidity resting below? Well, this fair value gap was mitigated in the previous example, but we have a fair value gap down here, and that will act as our drawn liquidity. So I'm looking for price to trade off this daily level, and then use the hourly external-to-internal move to frame a trade.
05:02
Speaker A
out let's see what happens so there we get tagged in and we get a move higher towards these highs completing the move from internal liquidity to external liquidity and skipping ahead you can see after hitting RTP if I would have moved my
05:21
Speaker A
Let's hop back down to the 5-minute chart to see how we could frame something. Down here on the 5-minute chart, you can see that we have price sweeping this high, and then our drawn liquidity is lower. So we're looking for price to displace below this low to give us our shift in market structure, and there we get displacement below this low. The next step is to look for a fair value gap. Here we have a fair value gap. If I'm going to look to enter a position there, where would I want to have my stop? Here you can see most of this price action is balanced above, but in here it's a little bit messy. Now, I want to have my stop over opposing candles. Let's see what that would look like, but if it's a little messy, let's zoom out a time frame. On the 15-minute chart, you can see everything is balanced. There are no fair value gaps, but we do have a little inversion right here. So ideally, I'd want to have my stop above that inversion and then target two R.
05:33
Speaker A
as well but for this model I'm just focused on catching 2 R let's hop into the next example so zooming back out to the hourly chart you can see we have our daily fair value gap which was just
05:45
Speaker A
Going back to the 5-minute chart, another thing I could do is take a position at the same spot, have my stop on the fair value gap candle's high, and then target two R. Let's see how both of these work out. Here we get tagged in, hit two R on the first, and two R on the second. You can see either one of these would have worked. This is just a more conservative stop loss than this one here. Let's go ahead and let this play out and see if we reach that hourly fair value gap.
06:02
Speaker A
here and that will act as our drawn liquidity so I'm looking for price to trade off this daily level and then use the hourly external to internal to frame a trade let's hop back down to the 5 minute chart to see how we could frame
06:17
Speaker A
For this next example, we'll also be on the NQ daily chart. Taking a look at the last few days of price action, what do you see? If we just mark out previous days' highs and lows, you can see that Thursday here swept Wednesday's high, and then Friday reversed, closing below the opening price here. You can see how these previous day lows are all lined up here, and that is low-resistance liquidity. So we're looking for a point of interest. The two spots that I look for, like this, are the opening price as well as the mean threshold of this up-close candle. Now, just in terms of premium and discount of the range, it makes more sense to look at the mean threshold here. So dropping down to the hourly, I want to see when we enter a kill zone or reach the point of interest. You can see, as this fair value gap is holding, it doesn't seem like t
06:36
Speaker A
structure and there we get displacement below this low now the next step is to look for a fair value Gap so here we have a fair value Gap so if I'm going to look to enter a position there where
06:49
Speaker A
would I want to have my stop well here you can see most of this price action is balanced above but in here it's a little bit messy now I want to have my stop over opposing candles let's see what
06:59
Speaker A
that would look like but if it's a little messy let's go ahead and zoom out a time frame so to the 15 you can see here everything is balanced you can see there's no fair value gaps but we do have a little
07:10
Speaker A
inversion right here so ideally I'd want to have my stop above that inversion then look to Target 2 R going back to the 5 minute chart another thing I could do is take a position at the same spot have my stop
07:24
Speaker A
on the fair value Gap candles high and then look to Target 2 R so let's see how both of these work out but here we get tagged in hit two r on the first and two r on the second so
07:38
Speaker A
you can see either one of these would have worked this is just a more conservative stop loss than this one here let's go ahead and let this play out and see if we do reach that hourly fair value
07:50
Speaker A
gap for this next example will also be on NQ daily chart and so taking a look at the last few days of price action what do you see so if just marking out previous days highs and lows you can see
08:01
Speaker A
that Thursday here swept Wednesday's high and then Friday reversed closing below the opening price here and you can see how these previous day lows are all lined up here and that is low resistance liquidity so looking for a point of
08:16
Speaker A
Interest the two spots that I look for like this is the opening price as well as the mean threshold of this up close candle now just in terms of premium and discount of the range it makes more sense to look at the mean
08:31
Speaker A
threshold here so dropping down to the hourly I want to see when we enter a Kill Zone or reach the point of interest you can see as this fair value Gap is holding it doesn't seem like the opening price is going to push us lower
08:44
Speaker A
so we're likely to reach a little bit further up towards the main threshold of this you can see we're into London now do we form a high nope we do not we just kind of consolidate and then as we enter to New
08:59
Speaker A
York we do reach up into the mean threshold so this point of Interest now if you notice on the hourly chart it is a little bit messy here right so what can we do can move up a time frame to
09:10
Speaker A
the 4our and this cleans it up a little you can see we have a fair value Gap right here or internal liquidity and what do we have resting below these previous day lows so that is our low resistance liquidity or our
09:27
Speaker A
Target so now dropping back down to the 5 minute chart let's see if we can find a sweep and an entry on a fair value Gap so here we are we get a little sweep of this 830 high and then we displace
09:45
Speaker A
lower creating quite a large fair value Gap so getting our shift and structure here so with our sweep here in our shift inst structure we have a very aggressive displacement down now ideally I don't want to see this met with displacement
09:59
Speaker A
back up because if we have expansion into expansion it's likely to go higher so I can either look to take an entry either at a premium of this range or at the consequent encroachment of this fair value Gap or I can let it start to trade
10:13
Speaker A
away before I enter in this case we're going to just take an entry at the consequent encroachment with my stop on this high and then looking to Target to R there we are let's see how this works out and there we we go we hit 2 R
10:31
Speaker A
zooming back out let's go see if we run these lows which was our draw on liquidity and we do go run those lows so if I was to leave Runners it would have worked out however I'm just interested
10:44
Speaker A
in catching two r with this model now in this next example I realized that not everyone can look to trade intraday so we're going to go over a higher time frame example if you remember from my important liquidity levels videos
10:58
Speaker A
previous candles High and low are important liquidity levels so you can see here previous month's low is an important liquidity level from here I'll drop down to the daily chart so here on the daily chart you can see we took
11:11
Speaker A
previous month's low before making a move higher creating equal lows these equal lows are then ran out and so what do we notice on the daily chart here well we also have this kind of megaphone pattern here which I'll talk about in a
11:26
Speaker A
future video but we have external liquidity looking for where internal liquidity and another thing you can notice is this is sitting right around discount of this range so with that idea in mind we'll drop down to the hourly
11:43
Speaker A
chart and look for a shift in structure and then a fair value Gap entry so if we're looking for a shift in structure we have the down move here I want to see a market structure shift here and then a
11:56
Speaker A
fair value Gap entry so here we get a market structure shift and what do we have right here a fair value Gap so looking to take an entry there my stop on this low and then looking to Target to R which puts us right at these
12:16
Speaker A
highs resting right below the fair value Gap let's see how this works out takes a little bit of draw down here and there we go we go and hit our TP so this is a great example of moving time
12:37
Speaker A
frames around if I can't trade intraday on The Daily hour and 5 minute chart I can move that up to the monthly daily and then hourly chart to get an entry for either a swing trade or just a
12:49
Speaker A
larger time frame where I don't have to watch intraday movement so here we are with another example on the higher time frames and what do we notice right here we have internal liquidity or a higher time frame level on the weekly chart so
13:03
Speaker A
I'm anticipating this to go internal liquidity to external liquidity or reach from this fair value Gap to this high now dropping down to the 4H hour chart from the weekly chart what do I want to look for here well I could just use this
13:18
Speaker A
as my entry time frame and look for a shift in Market structure and a fair value Gap to then go higher but I can also wait for internal to external on the 4H hour chart and then drop down
13:29
Speaker A
lower for an entry let's see if we get that so here there's actually a few ways we could trade this but we reach this external liquidity now we have internal liquidity so I would anticipate price dropping down into this internal
13:47
Speaker A
liquidity but since it is against my higher time frame bias I would rather not trade this retracement wait for the retracement to occur and then trade the expansion out of this so let's see what the next candle does here we do get that
14:02
Speaker A
moved down now that we're internal looking for external let's drop down to the 15-minute chart looking for this move from the fair value Gap to this high so now that we're down here on the 15minute chart you can see we have that
14:17
Speaker A
internal 4-Hour fair value Gap reaching for the external High I'm anticipating this to be a market maker buy model do we have a shift in Market structure we do so now from here I'm looking for a retracement to a fair value gap which we
14:35
Speaker A
do have right here now let's see how this plays out we actually make another fair value Gap right here why would I prefer this one well it's just closer to a discount of this range as well as lining up with the bodies of this
14:49
Speaker A
breaker block here now if I'm looking to trade this I want my stop on the low or below the down close candles here and then I'll be looking to have my Target at 2 R now this is a little bit over
15:03
Speaker A
this high but that is fine because we are trading with the higher time frame order flow let's see how this works out here we do get tagged in and there we go finally hit RTP there now if we zoom out here you can see why
15:22
Speaker A
it's easier to trade with the higher time frame order flow a retracement I was just talking about earlier if I didn't reach my 2 r it would have came and stopped me back out but here I'm anticipating price to reach for this
15:34
Speaker A
high so even if I was to let runners go can get a very high R trade let's see what happens and there we go we continue higher I hope you found this video and model helpful I did give a few examples
15:48
Speaker A
of higher time frame setups as well as intraday setups now I personally prefer a daily hour and 5 minute setups as it aligns with the formation of the daily candle but I also dropped a few higher time frame setups as I've been asked in
16:02
Speaker A
the comment sections to do so now I hope you have a great rest of your day and I'll see you guys next time have a good one
Topics:ICTinternal liquidityexternal liquidityfair value gapliquidity modelmarket structure shiftkill zoneNQ futures2R targetprice action

Get More with the SozAI App

Transcribe recordings, audio files, and YouTube videos — with AI summaries and speaker detection. 30 minutes free.

Or transcribe another YouTube video here →