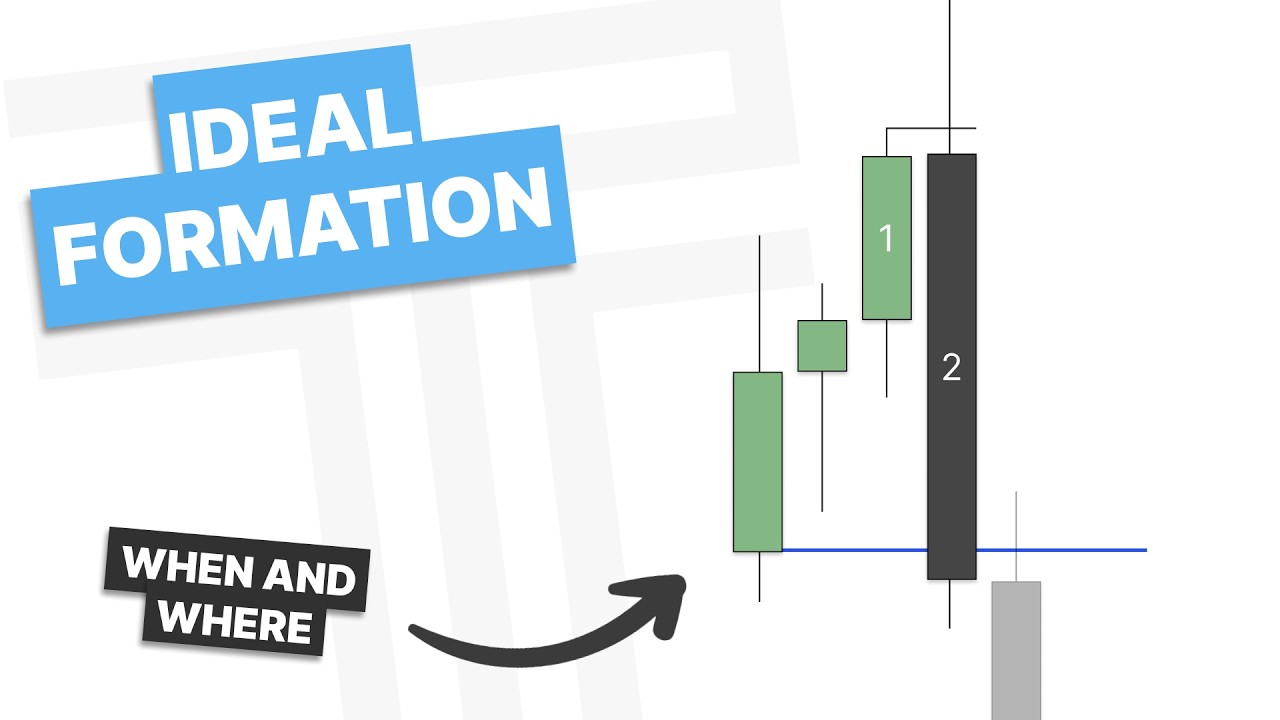
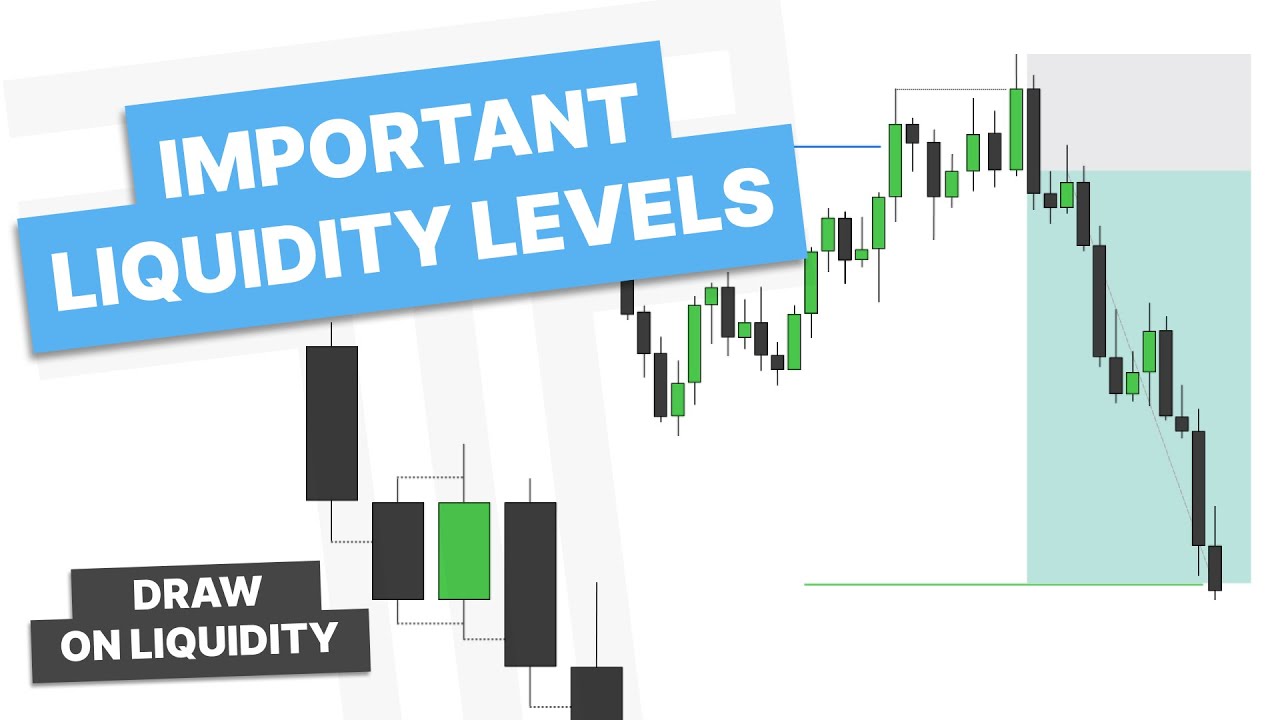
TTrades explains the failure to manipulate concept in trading: when price takes out a range high or low but fails to reverse, traders can trade the continuation or breakout, confirmed with structure a
Key Takeaways
- A failure to manipulate (failure to reverse off a range extreme) signals a likely continuation or breakout rather than reversal.
- Wait for a retest/continuation and a candle close before entering, using a change in state of delivery as confirmation.
- Always pair structure-based setups with higher timeframe bias; structure alone is insufficient.
- Stops are typically placed beyond the protected swing low/high of the setup.
What the video covers
- Failure to manipulate occurs when price sweeps a high or low of a range but fails to form a reversal, suggesting continuation in the original direction.
- Instead of trading a breakout immediately, the trader waits for a continuation or retest of the prior range before entering.
- The concept is contrasted with the accumulation-manipulation-distribution (AMD) model, where a sweep is followed by reversal to the opposite side of the range.
- Lower timeframe change in state of delivery (CISD) is used to confirm whether a sweep leads to reversal or continuation.
- Patience is emphasized: traders should wait for candles to close rather than act before closure.
- Multiple chart examples on TradingView demonstrate range sweeps with and without reversal, with a 2R target example shown.
- The concept should not be used in isolation; it must be combined with a higher timeframe bias or reason for a trade, tied to the fractal model.
- The author's preference is the hourly or 30-minute timeframe paired with a daily timeframe for analysis.
- A final example shows a failure to manipulate leading to a bullish breakout over a high, a retest into a gap, and a long entry with a stop below the protected low.
- The speaker recommends reviewing past charts to practice identifying these patterns rather than relying solely on replay.
Chapters
- 00:00Introduction to Failure to Manipulate
- 00:49Defining the Failure to Manipulate Concept
- 01:28Overview of Expansion and Range Example
- 02:28First TradingView Example: Range Structure
- 03:49Second Example and Lower Timeframe Confirmation
- 04:27Combining Structure with Higher Timeframe Bias
- 06:29Third Example: Hourly/Daily Setup and Long Entry
- 11:00Conclusion and Study Recommendations
Full Transcript — Download SRT & Markdown
Speaker A
How's it going everyone and welcome back to another video. In this video, we are going to talk about failure to manipulate or price failing to form a reversal so we can trade the continuation or the breakout of a range.
Speaker A
Now, if you haven't already seen my video on why continuations fail, please check that out first as it is very helpful to understand this video. But as you can see here, we have some sort of consolidation range. Now, generally
Speaker A
speaking, I'm not going to trust a change in the state of delivery or a breakout of this high because that is where I'm looking for a reversal. So you can see, price reaches into this high, sweeps out, we have a nice aggressive
Speaker A
candle back in, then we can trade to the other side of the range. Now, what is the failure to manipulate? The failure to manipulate is when price takes out a high or a low and fails to form a
Speaker A
reversal or fails to reverse off of that level. So if price is failing to form a bearish reversal here to go lower, where is it likely to go? Higher. So, I'm not just going to naturally trust this whole
Speaker A
candle here and just try to trade the breakout. I'm going to first wait for a continuation to form. Here we form a continuation, basically a retest of this previous range to then look to see a breakout higher and that is how I look
Speaker A
to trade a failure to manipulate a level. So let's take a look at what an example of this looks like. So you can see, we have price expanding higher and we're into a range here. Now normally with a range, if we sweep out the high,
Speaker A
I want to see if we can go to the other side of the range before looking higher, but if we get the failure to form that reversal or a failure to manipulate, not manipulating this high to go lower, we
Speaker A
can look for this to expand higher. And what do we notice here? We trade into this high, we don't have a reversal on a lower time frame. This is just expansion into a high, a retracement, now we're forming a new continuation or
Speaker A
a higher low here where I could look to get on side with this move higher.
Speaker A
So, let's get into TradingView and go over some real examples of this or the failure to manipulate.
Speaker A
So, here we are in our first example and you can see we have a pretty clear range here. You can see we have equal highs right here that have not been taken out for a series of time. And we have equal
Speaker A
lows right here. So, we have a range. Are we going to trade the manipulation of the range to the other side or are we going to trade the breakout or the failure to manipulate? And so, what are we looking for? Price reaches into this
Speaker A
level. We want to watch the phases of price here. Do we get price having an aggressive move lower and then met with an aggressive move to go higher? Or do we have, you know, a consolidation or a retracement to then continue lower? So,
Speaker A
let's see what happens. You can see we have a very aggressive move lower. We reach back higher here, but you can see these wicks. They're rejecting this previous range. So, essentially a breakout of this range cuz we have
Speaker A
expansion. This is looking like a retracement. So, what can we do? We could look for this to continue lower, right? And there we get the continuation lower. So, this first example is solely about the structure. You can see we have
Speaker A
some sort of range. When we take out one side of that range, what happens? Do we form a reversal or an AMD? So, accumulation, manipulation, and then distribution higher? Or do we fail to get that manipulation? The failure to manipulate this level leads
Speaker A
us lower. You can see in this case we failed to have a manipulation, so we just continue lower. Let's get into another example.
Speaker A
So, here we are in this next example. You can see I already have the low marked out here. We have expansion down, a little bit of a consolidation or a retracement here. So, you could see us trade into this level. Now, what do we
Speaker A
want to see at a level? Now, we want to see do we manipulate this low, form a reversal, and then go to the other side of the range, or do we fail to do that and have a further
Speaker A
breakdown? Now, before we get too far into this, you want to combine all of this structure analysis with a higher time frame reason to be looking for a trade. So, if you're trying to trade the breakout of a range, you want that to be
Speaker A
paired with a bias or a reason for a trade. This is going into the fractal model. It's not used alone as a model, right? I'm not just trying to trade the structure like that.
Speaker A
So, let's go down to the lower time frame here. Here we are on the 1-minute. If we're going to try to trade the manipulation of this range, what are we looking for?
Speaker A
We're looking for a change in the state of delivery here. So, we'd be looking for price to take out this low, a series of candles into that low, go close over, then we could look for it to trade higher.
Speaker A
If it is going to break out of this range, it would not go close over this level, and then we'd want to see a lower high or a new continuation form. So, let's see what happens. And with this,
Speaker A
you really just have to be patient and let candles close, right? Don't try to make decisions prior to the candle closure.
Speaker A
So, right here, what do we get? Okay, this could go really either way. Another candle up, we could say that we are reversing off of this low. Let's give it another candle.
Speaker A
This doesn't really tell us much. We're kind of just consolidating here. This is pretty aggressive bearish. Let's see if we form a new continuation if we go higher.
Speaker A
And there you can see, what do we do? We have a bearish continuation, a new protected swing that is bearish.
Speaker A
So, with this, what could you say about this level on the 15-minute chart? We are not reversing off of this level. So, if we fail to reverse or fail to manipulate this low, we could be looking for a continuation lower, and that's
Speaker A
where you can look to take an entry, right? You can trade the breakout of this range using a new continuation. And here, let's see if we can get 2R out of this and see what happens.
Speaker A
And there you go, we hit 2R. You can see that is how you would trade the failure to manipulate. You want to blend this with a bias, so ideally you want to be bearish when you go look to do this.
Speaker A
You're not just trying to blindly short or long certain highs or breakouts. You want to blend it with something, right?
Speaker A
This is just structure confirmation. So, let's get into another example. Now, my personal preference in using this concept is usually on the hourly or 30-minute time frame paired with a daily time frame. So, what do we notice here?
Speaker A
We have that reversal right here and we take out this previous high. After running out this previous high, what do we have? A consolidation.
Speaker A
So, taking a look at this consolidation, what do we notice? Right? We're not even doing this on a replay. You don't have to use replay to study. You can just use the chart and you already know what's happening and that's great. You're
Speaker A
teaching yourself. So, if we were going to form a reversal off of this high, what would we have wanted to see? We would have wanted to see a bearish change in the state of delivery.
Speaker A
Right? So, price closing below this level. It doesn't. Right? We make a new high.
Speaker A
We'd want to see price do what? Get a new bearish change in the state of delivery. And so, you can see a lot of times the failure to manipulate is price failing to form a change in the state of
Speaker A
delivery in the other direction. So, you can see price is doing two things here that I really want you to notice. We reach up into this high, not only do we fail to form a change in the state of
Speaker A
delivery bearish, we have a very aggressive bullish closure here, which is the failure to manipulate a level, and this is how you would trade the breakout. You can see we're breaking out over this high, we retest back into this
Speaker A
gap, and then we have an ideal candle to closure. And if you wanted to get on side long, that is where you would do it, and you'd put your stop on this low.
Speaker A
Now, if you want to study this, go into your own charts, you don't need to go on replay and test yourself. Just go back in charts, you already know what is happening, and practice looking at it.
Speaker A
So, you can see, if you were always trying to frame bearish here, you still would have not gotten any setup because we never had a bearish change in the state of delivery. And we'll go ahead and mark those out in red so you can see
Speaker A
that. All right, we make a high, can't close below here. Make a new high, can't close below here. This series of candles up, we can't close below there. So, we're just getting continuations because we failed to form any bearish structure.
Speaker A
And that is where I really value this concept because it shows me price is not forming a reversal here, we're going to get a breakout or a continuation.
Speaker A
Let's get into another example. So, here we are in our last example, and I'm going to show you why you want to blend this concept and your structure with a higher time frame analysis. Now, I do this within my fractal model just
Speaker A
using the higher time frame candles and their closures, but what do we have here? If we zoom out, you can see we've had a large expansion up, and then we have a consolidation. Price is consolidating right now. If you notice,
Speaker A
we just took out this high in this consolidation range, and what does price do? Well, mechanically, you can see with the red dotted line here, we have a bearish change in the state of delivery.
Speaker A
All right, so that would tell us that price is forming a manipulation of this high to trade lower. Now, when you blend this with closures and what the candles look like, you can see price is actually forming a candle to closure with an SMT
Speaker A
bullish here. So, I would not look at this as a manipulation of this range, but if price reaches lower here into this gap, this is actually a bullish failure to manipulate this high because we are doing what? We are pairing it with the
Speaker A
higher time frame candles. This is actually forming a bullish continuation as you can see here, right? And we have a new bullish protected swing. So, now putting all that together, we have what? A reversal.
Speaker A
This is a continuation to trade higher. And this is actually a failure to manipulate. Price is taking out this high. It fails to actually form a reversal, which means we can look for price to break out of this range and go
Speaker A
higher here in this candle three. And you can see what also is it? It is a positional entry because we are forming that protected swing prior to the higher time frame candle open, in which case we could look to enter around the opening
Speaker A
price with our stop on that protected low. And so, that is why you want to blend this with an actual model, with actual higher time frame analysis cuz if you blindly use structure, you're not really going to do well. You want to blend it
Speaker A
with stuff. So, with that, I hope you learned something. This is a concept you need to practice. You don't need to go into replay. Just go back in the charts in hindsight and practice marking things up, seeing look like when they
Speaker A
manipulate and when they fail to manipulate. you have any questions, leave them in the comment section below.
Speaker A
I'll see you guys in the next video. Have a good one.
Topics:failure to manipulatebreakout tradingrange tradingchange in state of deliveryAMD modelprice actionmarket structurefractal modelTradingViewcontinuation trade

![Intro To TTrades Fractal Model [Indicator & Settings] — Transcript](https://i.ytimg.com/vi/CqMIh-Vvhbg/maxresdefault.jpg)


![Change In State Of Delivery [CISD] – Orderblock Formation – ICT Concepts — Transcript](https://i.ytimg.com/vi/CHIK5oBRKiw/maxresdefault.jpg)