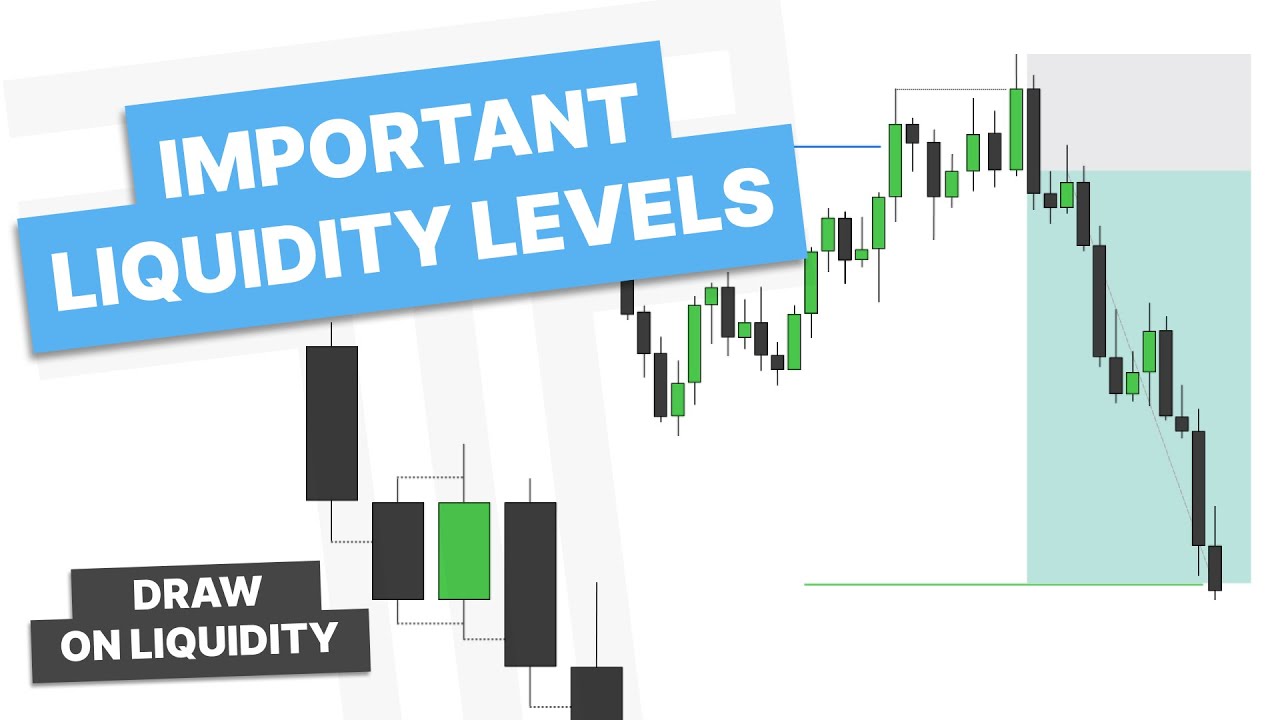
ICT tutorial on the Change in State of Delivery (CISD): how price shifts from bullish to bearish or vice versa, with chart examples and an entry model combining it with standard deviations and AMD.
Key Takeaways
- A Change in State of Delivery requires price to close through the reference candle's opening price, not just sweep liquidity.
- Use the opening price of the first candle in a series of same-direction closes as the CISD level.
- Lower-timeframe sweeps and CISD confirmations improve entry models.
- Combine CISD with order blocks, fair value gaps, and standard deviation projections to define targets and entries.
- Trade within premium for shorts and discount for longs relative to the dealing range.
What the video covers
- Introduces the Change in State of Delivery (CISD) concept from the ICT PDF: a shift from bullish to bearish or bearish to bullish price delivery.
- Explains bearish CISD: an up-closed candle or series of up-closed candles is closed below its opening price, signaling lower prices ahead.
- Explains bullish CISD: price sweeps a swing low, raids sell stops, then closes above a down-closed candle or series.
- For multiple up-closed candles, the opening price of the first candle in the series is used as the CISD reference level.
- Chart example 1 marks buy-side liquidity above old highs, drops to a 5-minute timeframe before New York open, and identifies the CISD after a lower-timeframe sweep.
- Shows that a sweep and displacement alone cannot change the state of delivery; a close through the reference level is required.
- Uses standard deviation projections from the manipulation leg to target the -2 to -2.5 area and London lows.
- Chart example 2 works top-down from the daily fair value gap, confirms bias on the hourly chart, and projects targets on the 2-minute timeframe.
- Combines the entry model: manipulation, then CISD, then order block or fair value gap retest, with entries limited to premium or discount of the dealing range.
- Demonstrates stop placement options (on the high or low) and targeting previous highs or fair value gaps aligned with the first standard deviation.
Chapters
- 00:00Introduction and Overview
- 01:20Defining the Change in State of Delivery
- 02:50Bearish and Bullish CISD Examples
- 05:00First Chart Example: Lower Timeframe Confirmation
- 08:00Top-Down Multi-Timeframe Example
- 12:00Combining CISD into an Entry Model
- 15:00Additional Examples and Trade Walkthroughs
- 20:00Closing Review
Full Transcript — Download SRT & Markdown
Speaker A
how's it going everyone. This video is going to be over the change in state of delivery. We'll first go over the PDF to learn what that is before going to the charts and finding some examples. At the end I will combine it with standard deviations and AMD to create an entry model.
Speaker A
deviations and AMD to create an entry model so here we are in the PDF and what is the change in state of delivery well the change State delivery is when price goes from bullish to bearish or from bearish to bullish now let's go through
Speaker A
So here we are in the PDF, and what is the change in state of delivery? Well, the change in state of delivery is when price goes from bullish to bearish, or from bearish to bullish.
Speaker A
closed candle or series of up closed candles gets closed below after being closed below I can anticipate price to trade lower similarly down here price puts in a swing low raids the sell stops and then closes over the series or
Speaker A
Now let's go through this example here. Price is moving up into a higher time frame PD array or important level. This up-closed candle here gets closed below here, and that is when the change in state of delivery occurs. When the opening price of this up-closed candle, or series of up-closed candles, gets closed below after being closed below, I can anticipate price to trade lower. Similarly, down here, price puts in a swing low, raids the sell stops, and then closes over the series or single down-closed candle, changing the state of delivery. When price returns, I can anticipate a reaction to trade higher.
Speaker A
closed candles I use the opening price of the first candle so I will look for this price to be closed below and then when price returns I can anticipate it to trade lower similarly down here there are three down Clos candles into the
Speaker A
Now let's take a look at two more examples. When there is more than one up-closed candle, or a series of up-closed candles, I use the opening price of the first candle. So I will look for this price to be closed below, and then when price returns, I can anticipate it to trade lower. Similarly, down here there are three down-closed candles into the important level. I will use the opening price of the first candle as my change in state of delivery.
Speaker A
example and I'm going to go ahead and Mark out our buy side liquidity resting above these old highs I'm then going to drop down to a 5 minute time frame and here we are just before New York open
Speaker A
So let's go into the charts and look at a few examples of this. Here we are with our first example. I'm going to go ahead and mark out our buy-side liquidity resting above these old highs. I'm then going to drop down to a 5-minute time frame, and here we are just before New York open. Let's go ahead and watch and see what happens.
Speaker A
without one so what I'm looking for here are the series or single up close candle that made the new high before displacing and closing below now where would that be right here we have one two candles that made the new high before the
Speaker A
You can see price displaces up over this high and then displaces back into the range. Now, I generally prefer a lower time frame sweep with my entry models, but we'll go ahead and mark it out without one. So what I'm looking for here are the series or single up-closed candles that made the new high before displacing and closing below. Where would that be? Right here we have one, two candles that made the new high before the displacement down, and I'd want to see a close below here. You can see price is failing to close below this level, and then we get a new sweep of a high.
Speaker A
price to change the state of delivery I'd want to see price close below these series of up close candles here and you can see price does close below those candles now that we have changed the state of delivery from
Speaker A
So now where would I look for price to change the state of delivery? I'd want to see price close below this series of up-closed candles here, and you can see price does close below those candles. Now that we have changed the state of delivery from bullish to bearish, I can be looking for price to trade lower. Where is lower? Well, we have London lows resting below right here. With that idea in mind, I could be looking for price to retest the order block with my stop on the high, targeting these London lows.
Speaker A
block with my stop on the high targeting these London lows now since this is 1.66 r and I generally prefer a minimum of 2 R what can I do I can take what we learned in the previous projection video
Speaker A
Now, since this is 1.66R and I generally prefer a minimum of 2R, what can I do? I can take what we learned in the previous projection video, project out this manipulation leg, and then look for the -2. Letting this play out, let's see what happens. You can see it tags the order block, respects this fair value gap in here, and now price trades and closes below this candle here, which is now validating it as an order block. And there you go, we hit the -2 to -2.5 standard deviations.
Speaker A
below this candle here which is now validating it as an order clock and there you go we hit the -2 to -2.5 standard deviations so just to review price goes sweeps an old high then displaces down however this can't change the state of delivery
Speaker A
So just to review: price sweeps an old high, then displaces down. However, this alone can't change the state of delivery. We get a lower time frame sweep, which changes the state of delivery, and then we can anticipate price to trade lower to London lows. From the standard deviation projection, I look for an entry model to gain entry into the move down.
Speaker A
the move down so let's hop into the next example so in this next example we are going to work top down from the daily and how you can use the change in state of delivery on multiple different time
Speaker A
So let's hop into the next example. In this next example we are going to work top-down from the daily, and I'll show how you can use the change in state of delivery on multiple time frames. You can see here we have a daily fair value gap right here, which would be the draw on liquidity. You can see price reaches up into this fair value gap, respects it, and closes down. Using the next-day model, we can anticipate price to move lower the next day, taking out the previous day's low.
Speaker A
we can anticipate price to move lower the next day taking out previous day low but let's hop into the hourly chart to confirm this bias so here we are on the hourly chart and ideally we want to see
Speaker A
But let's hop into the hourly chart to confirm this bias. Here we are on the hourly chart, and ideally we want to see a change in the state of delivery after engaging our higher time frame PD array. Well, here is our daily fair value gap, our higher time frame PD array. Do we get a change in the state of delivery after engaging with it? We do, as we displace and close below a series of up-closed candles here. Now, what else can we do from my latest videos to give us a target for this move down? We can project out this manipulation leg from the high to the low, then look for the -2 to -2.5 area for a target.
Speaker A
after engaging with it we do as we displace and close below a series of up Clos candles here now what else can we do from my latest videos to give us a target for this move down we can project
Speaker A
So let's get into the next day and see what happens. You can see here we are building a range, and we just put in equal lows. When we are bearish with price action, a run of an old high is an area to be looking short. So let's hop down to the lower time frames for this 9:30 open. In this case we'll use the 2-minute chart.
Speaker A
range and we just put in equal lows now when we are bearish with price action a run of an old high is an area to be looking short so let's hop down to the lower time frames for this 930 open
Speaker A
Here we are on the 2-minute chart. Let's zoom out so you can see where we're at. We have the old high that was just tagged right there, our equal lows here, and a -2 to -2.5 right here. We'll mark that out. Zooming back in, let's see what 9:30 open does. You can see 9:30 open manipulated up, closed back in the range. So if I want to see this move down, I'd want to see a change in state of delivery, or price closing below the series of up-closed candles here. Here we get that close, validating it as a change in state of delivery, so I'd be looking to enter a short position here with my stop on this high.
Speaker A
lows here and we have a -2 to -2.5 right here so we'll go ahead and Mark that out zooming back in let's see what 930 open does so you can see 930 open manipulated up closed back in the range so if I'd
Speaker A
Now, what can I do for targets? I can also project off this manipulation, like here. Let's zoom back out. Ideally I'm looking for targets in the -2 to -2.5 area. We have equal lows there, as well as the -4 to -4.5 there, but we also have our hourly target here. I'm going to put my target just on these equal lows, but we'll see how these areas react. Let's zoom back in. Here we get tagged in with some choppy displacement down. Zooming back out, there we go, and we hit the low. You can see we hit our -2 to -2.5 and our -4. Let's see if we reach for that hourly target, and we do reach for it.
Speaker A
I'd be looking to enter a short position here My Stop on this high now what can I do for targets well I can also project off this manipulation like here and let's go ahead and zoom back out now
Speaker A
Now let's go back out to the hourly chart to review. We went from our higher time frame PD array, which in this case was a daily fair value gap. We waited for the change in state of delivery on the hourly chart, and then the next day we had a sweep of buy-side liquidity, which is an area to get short when price is bearish. From here we looked for the change in state of delivery on the 2-minute chart to get short, targeting these equal lows on the hourly chart as well as the projections from the high of the week.
Speaker A
put my target just on these equal lows here but we'll see how these areas react so let's go ahead and zoom back in so here we get tagged in pretty choppy some displacement down and zooming back out there we go
Speaker A
Now that you understand the change in state of delivery, how do I combine all this into an entry model? What I focus on is a manipulation, then a change in state of delivery, and then I focus on order blocks and fair value gaps to deliver price to projections. So let's go over a few examples of that.
Speaker A
hourly chart just to review this we went from our higher time frame PD array which in this case was a daily fair value Gap we waited for the change in state of delivery on the hourly chart and then the next day we had a sweep of
Speaker A
You can see right here we have created a range. Let's see what happens. You can see price is failing to displace out of this range, but that is the first thing, manipulation. The next thing I look for is a change in the state of delivery, so I would need price to close below this last up-closed candle. You can see we have not closed below it yet, and then there is our close below. That is our change in state of delivery. Now, if I'm looking to take the first entry, I'm looking to enter here at the change in state of delivery, or when it retests the order block, with my stop on the manipulation high that swept. For targets, I like to project out my targets. Here I have a low I can be targeting, but I can keep in m
Speaker A
from the high of the week now that you understand the change in state of delivery how do I combine all this into an entry model well what I focus on is a manipulation then a change in state of
Speaker A
delivery and then I focus on order blocks and fair value gaps to deliver price to projections so let's go over a few examples of that so you can see right here we have created a range let's see what
Speaker A
happens you can see price is failing to displace out of this range but that is the first thing manipulation the next thing I look for is a in the state of delivery so I would need price to close
Speaker A
below this last up close candle so you can see we have not closed below it yet and there is our close below so that is our change in state of delivery now if I'm looking to take the first entry
Speaker A
looking to enter here at the change of state of delivery or when it retests the order block my stop on the manipulation High which swept and then for targets I like to project out my targets now here I have a low I can be targeting but I
Speaker A
can keep in mind the -2 to -2.5 so ideally it would look something like this targeting the -2 standard deviations we're going to go ahead and just keep it on this low now we create more up Clos candles
Speaker A
here and close below them and now we have more order blocks so if I was going to miss the first entry I'd be looking for another entry here there we make more up close candles so I'd want to see this continue to support
Speaker A
price lower and another thing I'll do is I'm only going to be looking for entries within a premium of this dealing range here so above this line here you can see price is retesting that order block and there we go we break that
Speaker A
initial low let's go ahead and Mark out our -2 to -2.5 and now let's see if we can find something in the other direction so you can see we're building a range now we do reach into the -2 to
Speaker A
-2.5 and Below these lows so if this is going to become manipulation I'd want to see a change in the state of delivery or Price close close over the series of down close candles here and price does do that so the next
Speaker A
thing I do is I Look to project out this manipulation I Look to our left what do we have resting in the -2 to -2.5 we have an old high so that will be my first Target so if I'm looking for the
Speaker A
first entry I'm looking to enter on this change and state of delivery or the order block with my stop on the manipulation targeting this high now what I'm focusing on is a close over this down close candle so now that
Speaker A
they close over that it is also a valid order block so I'm looking for that to support price and we go reach that high and let's see how far we go you can see we consolidate but we do
Speaker A
go end up and hit that negative4 standard deviations so after cleaning up the chart a little let's go through what I look for one more time so the first thing is manipulation so you can see we have manipulation over an old high
Speaker A
before change in state of delivery once those two things occur I Look to project out this manipulation leg to give myself a Confluence or targets after that occurs I look for order blocks and fair value gaps to support price lower or
Speaker A
higher in this case lower and then the same thing on the other side over here we have manipulation once that is confirmed by changing the state of delivery I can then look for an entry on the order block or fair value Gap as
Speaker A
price reaches higher to these projection targets and liquidity levels last thing we're going to talk about in this video is combining AMD or the Box setup with the change in state of delivery or an order block formation now I posted on my
Speaker A
community tab this post and so we're going to go over this example so if you notice right here we have some sort of range let's wait for the manipulation before we identify that so here we get the manipulation as
Speaker A
it we have an aggressive move out and then back into a range so going ahead and marking out this consolidation or accumulation and we'll also Mark out the highest body in that accumulation as that is the Box setup and we'll mark out
Speaker A
the deviation from this range or the manipulation generally the Box setup is a retest of these previous highs over here my stop there and then looking for targets well how can we get targets we can project out this manipulation leg
Speaker A
and look for that so this would be the normal box setup however if I want confirmation let's see what we would do so when price comes back up into this area instead of immediately taking an entry I'm looking for a formation of an
Speaker A
order block or a change in the state of delivery right here so you can see we have a high here that gets swept and then where is the series of up Clos candles that made the high right here and you can see price already
Speaker A
closed below the opening price of that validating it as an order block so then I can look for an entry here and then I can decide I can either put my stop here or up here in this case I'm comfortable
Speaker A
putting my stop here as we had a sweep and then I can look to Target that original projection so let's see how this works and there we go here we are building a range as we cannot make new highs or
Speaker A
lows so marking out the lowest bodies in that range and now go ahead and Mark out our accumulation our manipulation now we want to see this displace back into the range which it does now if I'm looking for a box setup
Speaker A
my original entry would be on a retest of this line here my stop on this low however let's wait for an order block formation there so you can see we have a down Clos candle into that area into the fair
Speaker A
value Gap so then I'm looking for a close over this candle here we get a close over this candle so then I will be looking to enter long there then I can either put my stop on this low or here right here I
Speaker A
would have my stop on this low and then I can project out this manipulation for a Target and in this case looking for a previous High here or this fair value Gap that lines up with the first standard deviation so we'll just go
Speaker A
here and there you go so that is the example from the post and I hope that makes sense and it gives you something to study I hope you found this video helpful if you did please consider liking and subscribing and if you want
Speaker A
to see a more in-depth video on that entry model please let me know in the comments below and I'll see you guys next week have a good one
Topics:change in state of deliveryCISDICT conceptsorder blockfair value gapstandard deviationAMDliquidity sweepentry modelprice action
![Intro To TTrades Fractal Model [Indicator & Settings] — Transcript](https://i.ytimg.com/vi/CqMIh-Vvhbg/maxresdefault.jpg)