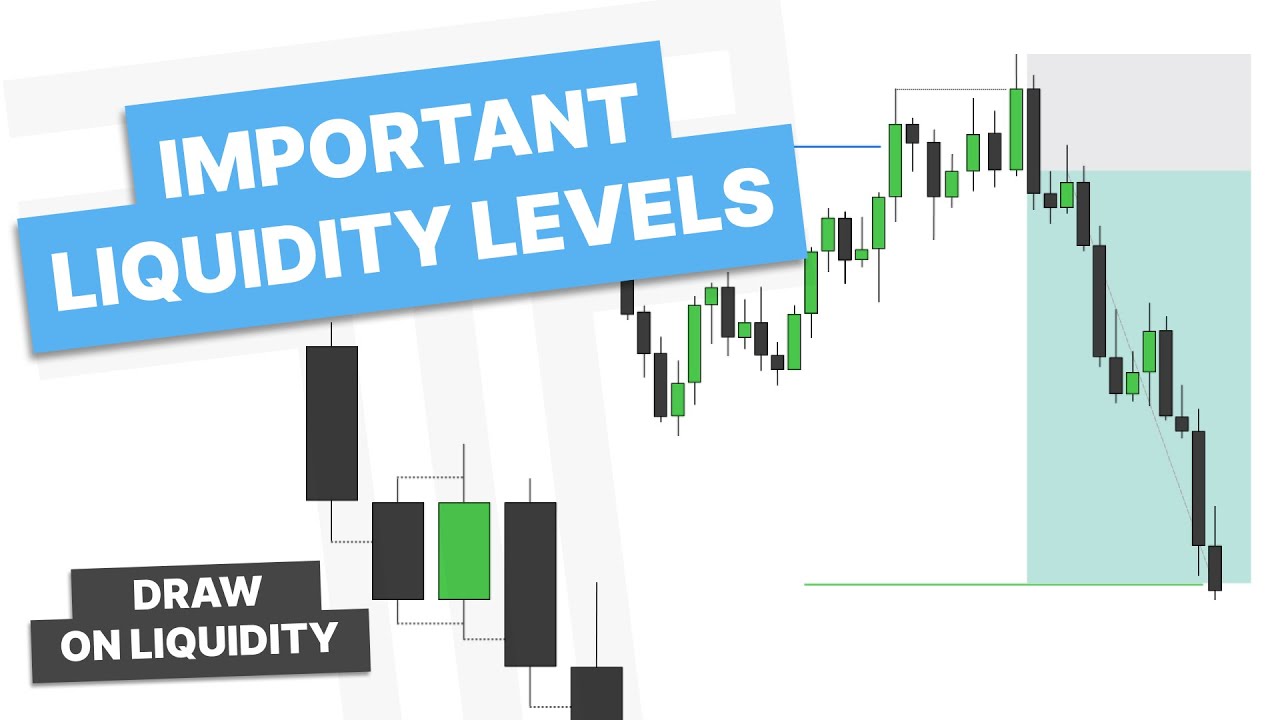
A trading tutorial on candlestick wicks: how to mark the 50% level of a lower-timeframe wick and recognize when price respects or disrespects it, with chart examples.
Key Takeaways
- A wick's 50% level is the key reference point for judging reversals.
- Respecting the 50% level supports continuation in the expected direction; breaking through it suggests a test of the extreme.
- Lower-timeframe price action can be aggregated to understand higher-timeframe wick behavior.
- Context such as consolidation or prior sweeps can reduce the probability of a wick-based setup.
What the video covers
- Defines wicks as lower-timeframe reversals where price aggressively moves in one direction and then returns during a time period.
- The key level to mark is the 50% point of the wick, measured from the body to the high or low.
- For bullish setups, price is expected to respect the upper half of a lower wick and trade higher.
- For bearish setups, price is expected to respect the lower half of an upper wick and trade lower.
- Combining lower-timeframe candles into a higher-timeframe candle shows how the wick was respected in aggregate.
- A wick is disrespected when price trades through the 50% level, making it likely to reach the extreme low or high.
- Example 1: price sweeps a previous day low and closes back in range, with expectation of a move higher from the wick's upper half.
- Example 2: price sweeps a previous day high and closes back inside the range, with expectation of a move lower respecting the wick's lower half.
- Example 3: on gold hourly charts, a wick is evaluated within a consolidation range, where lower probability is noted.
- Examples are drawn from daily, hourly, and 5-minute charts, using the lower timeframe to confirm higher-timeframe wick behavior.
Full Transcript — Download SRT & Markdown
Speaker A
how's it going everyone? This video is going to be over wicks. I'm first going to talk about what wicks are on the lower timeframe, and then talk about what it looks like for a wick to be respected, or for a wick to be disrespected.
Speaker A
respected or for a wick to be disrespected so what are Wicks Wicks are generally a lower time frame reversal where during a given time period price had an aggressive reaction so you can see here we have formed a wick so that
Speaker A
So what are wicks? Wicks are generally a lower timeframe reversal where, during a given time period, price had an aggressive reaction. So you can see here we have formed a wick, so that means during this given time period the lower timeframe went aggressively lower and then back higher. You can see here price made an aggressive move lower and then back up, and that's how wicks can be a reversal on the lower timeframe.
Speaker A
what areas do I Mark out with Wix the main focus for Wix is marking out 0.5 of this Wick from the body to the low or the body to the high in this I'm going to want to see the upper half of the
Speaker A
Now, what areas do I mark out with wicks? The main focus for wicks is marking out 0.5 of this wick, from the body to the low or the body to the high. In this, I'm going to want to see the upper half of the wick support price higher, or the lower half of the wick support price lower. So you can see here, in this case, the lower timeframe price action is shown. You can see the next candle opens up, we respect the upper half of this wick, and then trade higher. Here you can see price opens up on the lower timeframe, trades into this wick, it has a reversal that is formed, and then trades lower. So it respects the lower half of this wick.
Speaker A
the upper half of this Wick and then trade higher here you can see price opens up on the lower time frame trades into this Wick it has a reversal that is formed and then trades lower so it respects the lower half of this Wick now
Speaker A
Now what does that look like on the higher timeframe? Well, when we combine that lower timeframe into its higher timeframe candle, we get left with something like this. So you can see the lower timeframe opened, made a low, formed a high, and then closed, all while respecting the upper half of this wick. And you can see with the bearish example, price opened, formed a high in the lower half of this wick, and then traded lower.
Speaker A
and then closed all while respecting the upper half of this Wick and you can see with the bearish example price opened formed a high in the lower half of this Wick and then traded lower so what does it look like for wicks to be
Speaker A
So what does it look like for wicks to be disrespected? If it is going to be respected, price will open, form a low, and then trade higher through the given time period. However, if the upper half of this wick is not respected, then it is likely to trade to this low. So you can see here we do form that open low, we can't expand, we get a reversal, trade through 50% of this wick, and then we go and trade through the low. A similar thing here: you can see we don't respect the 50% or the lower half of this wick, and then we eventually trade through this high. So on the higher timeframes you can see this wick level here was infringed, and then we trade lower.
Speaker A
we do form that open low we can't go expand we get a reversal trade through 50% of this Wick and then we go and trade through the low and similar thing here you can see we don't respect the
Speaker A
Let's hop into some charts and go over a few examples of what this looks like. Let's first go through some examples in which price respected the wick. You can see here price takes out the low and closes back into the range. With my daily bias video, I'd be looking for price to trade higher. Now, higher from where? Well, with a reversal candle like this, I'm going to be focused on price respecting the upper half of this wick. So I'd want to see price trade into this area, open, form a low, then move higher, and then close. If we drop down to the hourly timeframe from the daily timeframe, let's take a look at that. Here we are on the hourly chart. You can see this is our previous day low that was taken out and closed back through. Now, if we're going to trade higher, I'd want to see price respect this upper half of the wick. So I'd want to see open, low, then trade higher into these highs before closing. As we continue, you can see we are forming a low, we have open low, we get expansion higher. So you can see on this higher timeframe, if we draw this out, you can see how the higher timeframe candle respected this wick. We get the open, low, high, and wherever it closes, and that's what it looks like on the lower timeframe.
Speaker A
examples of what this looks like so let's first go through some examples in which price respected the wick so you can see here price takes out the low and closes back into the range with my daily bias video I'd be looking for price to
Speaker A
Let's hop into a few more examples. Once again, you can see price traded into our previous day high, has swept that out, and then closed back inside the range. So I'd be looking for price to trade lower the next day. With this closure, I'd want to see price respect 0.5 of this wick. Marking that out right there, I'd want to see open, high, low, close. Once again, we'll go to the hourly chart to take a look at this. Here we are on the hourly chart. You can see we have that closure inside previous day high, giving us that nice large wick and a closure back inside the range, that is paired with a change in the state of delivery. I've marked out 0.5 of that wick. So if price is going to trade lower in this next day, I'd want to see price form a high in the lower half of this wick to expand lower. As we let this play out, we are getting some consolidation here. We then sweep the high in the consolidation, and then we start to expand lower. So you can see we opened, we formed a high in the lower half of this wick, before expanding lower into these previous day's lows.
Speaker A
close so if we drop down to the hourly time frame from the daily time frame let's take a look at that so here we are on the hourly chart you can see this is our previous day low that was taken out
Speaker A
For our next example, you can see we are on the hourly chart here. We have price reaching into a fair value gap, forming a closure right here back inside the previous candle range. And what do we notice? We have a nice large wick. So if we are going to have price expand, I would anticipate a wick to form in the upper half of this wick. When I drop down to the 5-minute chart here to take a look at the hourly, you can see that if price is going to expand higher, I'd want to see an open, low, high, close, while not going below 50% of this wick. As we let this play out, you can see price opens, we form a low in this fair value gap, and then we expand higher. As we let this continue to play out, we get a nice expansion out of the upper half of this wick.
Speaker A
see we are forming a low we have open low we get expansion higher right so you can see on this higher time frame here if we draw this out you can see how the higher time frame candle respected this
Speaker A
Here we are in our next example. You can see we have just taken out this high to our left, and we have price closing back inside the range here. So if I'm looking for price to trade lower, I'd want to see price respect 0.5 of this wick. Let's drop down to the 5-minute timeframe. Here we are on the 5-minute timeframe, and if price is going to trade lower, I'd want to see price open, form a high while respecting 0.5 of this wick, and then trade lower. As we let this continue, price opens, goes slightly lower. Then I want to see if it respects this wick. It does not respect this wick, as it is closing over. Now it is more likely to reach for this high than go and respect this wick and then expand lower, especially after already taking out its previous candle low. As we let this continue to play out, you can see we then get an expansion in that direction. So this is an example of when a wick is disrespected, or this reversal fails.
Speaker A
into our previous day high has swept that out and then closed back inside the range so I'd be looking for price to trade lower the next day now with this closure I'd want to see price respect 05 of this Wick so marking that out right
Speaker A
Let's go into a couple more examples of these. Here we are on the ES hourly chart. If price is going to trade lower and respect this wick, I'd anticipate it to do it within the lower half of this wick. So let's drop down to the lower timeframe, in this case the 5-minute, to see if that occurs. Here we are on the 5-minute chart. Price has formed this little reversal right here, so let's see if that is respected. You can see right away we are closing over 50% of this wick and inverting this fair value gap. So now I would say it's more likely to take out this high than it is to expand lower. As we use this as a support level, now after inverting 50% of this wick, we then trade higher to take out this high. Let's let this play out a little longer. You can see we start to expand higher from there.
Speaker A
previous day high giving us that nice large Wick and a closure back inside the range that is paired with a change in the state of delivery and I've marked out 05 of that Wick so if price is going
Speaker A
In this next example, we are on gold hourly. One thing to notice is we are in this consolidation range. We've taken out this high and we have not taken out this low. You can see right here we do have a nice wick that respects 50% of this to trade lower. Here we have another candle with a nice wick. This could look like it's going to trade higher, obviously, but with the context that we're in a consolidation, that makes it lower probability. Let's still take a look at it anyways. We have closed back inside the previous candle's range, and I'd want to see if price respects 0.5 of this wick. So let's go to the 5-minute chart. Here we are on the 5-minute chart, and as price opens up, you can see it starts to trade lower and immediately just falls through 50% of that wick. So it is not likely to form an exp
Speaker A
consolidation and then we start to expand lower so you can see we opened we formed a high in the lower half of this Wick before expanding lower into these previous days lows for our next example you can see we are on the hourly chart
Speaker A
here we have price reaching into a fair value Gap forming a closure right here back inside the previous candle range and what do we notice we have a nice large Wick so if we are going to have price expand I would anticipate a wick
Speaker A
to form in the upper half of this Wick so when I drop down to the 5 minute chart here to take a look at the hourly you can see that if price is going to expand higher I'd want to see an open
Speaker A
low high close while not going below 50% of this Wick so as we let this play out you can see we price opens we form a low in this fair value Gap and then we expand higher so as we let this just
Speaker A
continue to play out we get a nice expansion out of the upper half of this Wick here so here we are in our next example you can see we have just taken out this High to to our left and we have
Speaker A
price closing back inside the range here so if I'm looking for price to trade lower I'd want to see price respect .5 of this Wick here so let's drop down to the 5 minute time frame so here we are
Speaker A
on the 5 minute time frame and if price is going to trade lower I'd want to see price open form a high while respecting 0.5 of this Wick and then trade lower so as we let this continue price opens goes slightly lower
Speaker A
then I want to see if it respects this Wick it does not respect this Wick as it is closing over now it is more likely to reach for this High than go and respect this Wick and then expand lower
Speaker A
especially after already taking out its previous candle low so as we let this continue to play out you can see we then get an expansion in that direction so this is an example of when a wick is disrespected or this
Speaker A
reversal sales let's go into a couple more examples of these so here we are on ES hourly chart and if price is going to trade lower and respect this Wick I'd anticipate it to do it where in the
Speaker A
lower half of this Wick so let's drop down to the lower time frame in this case the 5 minute to see if that occurs so here we are on the 5 minute chart price has formed this little reversal
Speaker A
right here so let's see if that is respected and you can see right away we are closing over 50% of this Wick and inverting this fair value Gap so now I would say it's more likely to take out
Speaker A
this High than it is to expand lower so as we use this as a support level now after inversing 50% of this Wick we then trade higher to take out this high so let's let this play out a
Speaker A
little longer you can see we start to expand higher from there so in this next example we are on gold hourly and one thing to notice is we are in this consolidation range we've taken out this high and we have not taken out this low
Speaker A
so you can see right here we do have a nice Wick respects 50% of this to trade lower and here we have another candle with a nice Wick so this could look like it's going to trade higher obviously
Speaker A
with the context of we're in a consolidation that makes it lower probability but let's still take a look at it anyways so we have closed back inside the previous candle's range I'd want to see if price respects .5 of this
Speaker A
Wick so let's go to the 5 minute chart so here we are on the 5 minute chart and as price opens up you can see it starts to trade lower and immediately just falls through 50% of that Wick so it is
Speaker A
not likely to form an expansion candle within this given time period as this would form too large of a wick for an expansion candle it's more likely to take out this low and there we go so you can see consolidation lows were then
Speaker A
taken out but this is another example of when a wick is not respected so here we are in our last and final example and what do we notice here price respected the upper half of this Wick here to
Speaker A
trade higher into this fair value Gap after reaching into this fair value Gap price then closed back inside the range of its previous candle so if price is going to trade lower off of it where would we want to see price respect we'
Speaker A
want to see it respect 05 of this Wick so as we drop down to the hourly chart or the lower time frame you can see here on the hourly we do have a change in the state of delivery for this hourly
Speaker A
reversal and we do have some failure swings here so if price is going to form a high I'd want to see it form it in the lower half of this Wick to then trade lower so you can see the start of this candle we trade
Speaker A
lower almost immediately here we do lack an upper Wick so we may revisit that but this is a nice move for this expansion candle now if I was focused on the New York session we do come back up we form
Speaker A
this upper Wick and we are heading into the New York Hill Zone and what do we notice we have price respecting this candle here so same thing here if price was going to respect or move lower I'd want to see it respect 05 of this Wick
Speaker A
so dropping down to the 5 minute time frame now down here on the 5 minute time frame I've marked out 05 of this higher time frame Wick in this case the hourly time frame and ideally I'd want to see
Speaker A
price respect this area now you can see with this closure over to me it is more likely to take out this High than to expand lower so I'm either not going to try to catch this reversal up here or wait for more
Speaker A
confirmation with a close below here so as we let this continue we do get this close below here so if I did want to still try this trade out I could look to enter on the close my stop on this high and then targeting
Speaker A
to R so as we let this play out you can see there we do go hit to R now the reason I wanted to show an example like this is it's not always going to be perfect right there are
Speaker A
going to be times when price closes over this level and it still expands lower there's going to be times where price respects this level and then right towards the end of the candle it runs it out nothing is is going to be just
Speaker A
perfect all the time and so there are things to do where I look for extra confirmation or less confirmation depending on what the lower time frame looks like however I hope you enjoyed this video on Wix if you did please
Speaker A
consider liking and subscribing and I'll see you guys in my next video have a good one
Topics:candlestick wicksprice actionreversal trading50% wick levellower timeframe analysisliquidity sweeptrading tutorialdaily biasgold tradingES futures
![Intro To TTrades Fractal Model [Indicator & Settings] — Transcript](https://i.ytimg.com/vi/CqMIh-Vvhbg/maxresdefault.jpg)


![Change In State Of Delivery [CISD] – Orderblock Formation – ICT Concepts — Transcript](https://i.ytimg.com/vi/CHIK5oBRKiw/maxresdefault.jpg)