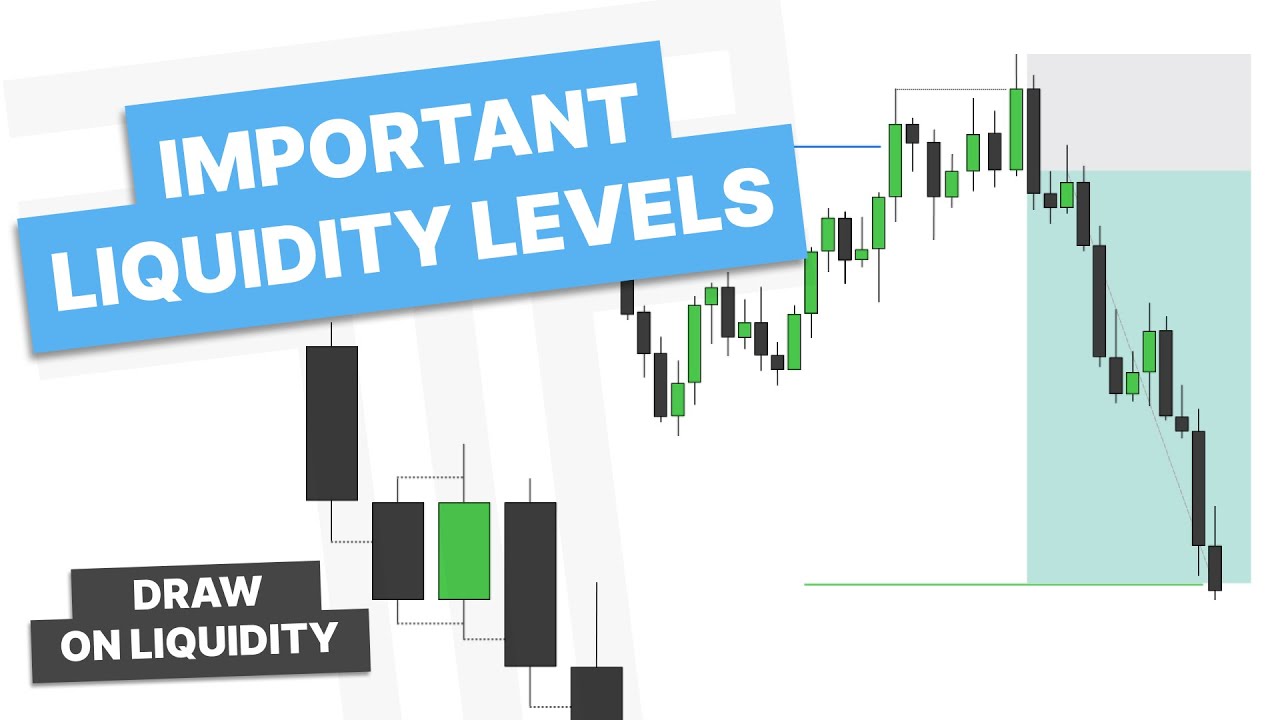
ICT trader TTrades explains order block reversal entries: identifying liquidity sweeps, fair value gaps, and the last opposing candle as a support/resistance zone across DXY, oil, NQ and gold charts.
Key Takeaways
- Order blocks are most valid when they follow a liquidity sweep and are confirmed by a close through the candle.
- Combining an order block with a fair value gap or higher-timeframe level increases confluence.
- The opening price of the order block candle is the key level to watch for support or resistance.
- Lower-timeframe sweeps paired with full-bodied displacement candles are preferred entry triggers.
What the video covers
- The presenter calls order blocks his favorite entry and reversal model, starting with a PDF overview before chart examples.
- Setup begins with an important level such as a previous day high/low or buy-side/sell-side liquidity resting above or below price.
- After price raids a short-term high or low on a lower timeframe, the trader focuses on the last up-close (bearish setup) or down-close (bullish setup) candle or series of candles.
- An order block is validated when price closes beyond that candle, and the candle's opening price is then watched as support or resistance.
- Fair value gaps are used as points of interest, often overlapping with order blocks to form confluence.
- DXY daily example: a fair value gap is filled, liquidity is swept, and a down-close candle that swept lows supports price higher after a close above its high.
- US oil daily example: a weekly fair value gap and previous month's high frame the trade, with a full-bodied up-close candle later validating an order block that supports price lower.
- NQ 5-minute example: overlapping PD arrays (fair value gap and order block) are combined, and a lower-timeframe sweep with a full-bodied candle is treated as a valid entry trigger.
- Gold weekly-to-4-hour example: a swing high and fair value gap on the weekly chart are used, with the 4-hour order block refined for entry.
- Full-bodied candles are preferred over wicks; wicks reaching into a zone are acceptable if the body still respects the candle.
Chapters
- 00:00Introduction to the Order Block Model
- 01:08Defining Key Levels and Liquidity
- 01:56DXY Daily Order Block Example
- 03:40US Oil Weekly Fair Value Gap Example
- 05:18Oil Retests and Support Levels
- 05:33NQ 5-Minute Liquidity Sweep Example
- 07:33Gold Weekly to 4-Hour Setup
- 10:08Market Structure Shift Confirmation
Full Transcript — Download SRT & Markdown
Speaker A
This is my favorite entry model or reversal model, and that is using order blocks. So we will hop into a PDF and go over that before hopping into some examples on the charts. This is my favorite reversal pattern.
Speaker A
favorite reversal pattern. Now the first thing I start with is an important level. Whether this is a PDRA or buy side liquidity is resting above price here. On a lower time frame, price reaches up and puts in a swing high.
Speaker A
Now, the first thing I start with is an important level. Whether this is a PDRA or buy-side liquidity, it's resting above price here. On a lower time frame, price reaches up and puts in a swing high. Price then reaches up and raids this high here. My eyes go to this up-close candle, or series of up-close candles, here. When price closes below this up-close candle, it then validates this order block, and I'm looking for it to support price lower.
Speaker A
price lower. Similarly, down here, I have an important level resting below price. Price then creates a short-term low. It then raids this low. My eyes go to where? This down close candle here or series of down closes candles. When
Speaker A
Similarly, down here, I have an important level resting below price. Price then creates a short-term low. It then raids this low. My eyes go to where? This down-close candle here, or series of down-close candles. When price closes over this down-close candle, I'm looking for it to support price higher.
Speaker A
fair value gap as our point of interest. So if we zoom in here, you can see we have a fair value gap resting above us here. So let's see if we put in a swing low here. We do put in a swing low. So
Speaker A
So, let's get into the charts and look at a few examples of this. So here we have DXY on the daily chart, and we're going to be watching this daily fair value gap as our point of interest. So if we zoom in here, you can see we have a fair value gap resting above us here. So let's see if we put in a swing low here. We do put in a swing low. So now we have liquidity resting right above our point of interest. Let's see what happens. We fill this fair value gap. We get a move down. Don't quite take these lows yet.
Speaker A
We get a move down. Don't quite take these lows yet. The next day, we sweep these lows into the point of interest. So, what are my eyes looking at? This down close candle into the point of interest that swept
Speaker A
The next day, we sweep these lows into the point of interest. So, what are my eyes looking at? This down-close candle into the point of interest that swept these lows. So, I want to see when price closes over this high. So, price closes over this high. So, now I'm going to be looking at the opening price of this order block. So, let's see what happens.
Speaker A
Now, we have a fair value gap here as well. price reaches into this order block.
Speaker A
Now, we have a fair value gap here as well. Price reaches into this order block. It's important to notice the close is outside the opening price of the order block, and the following, or next day, we get a move higher, reaching for this high here.
Speaker A
So you can see how the down close candle on the move that swept these lows here into the point of interest was used to support price higher. We are going to be looking at US oil on the daily chart.
Speaker A
So you can see how the down-close candle on the move that swept these lows here into the point of interest was used to support price higher.
Speaker A
happens. We get a nice fullbodied up close candle into this point of interest. So, if we close below it, I would like to see it become an order block.
Speaker A
We are going to be looking at US oil on the daily chart. Now, if you notice, we have previous month's high resting here, and we have a weekly fair value gap resting below us here. We just put in a swing high here and a swing low here. So, let's see what happens.
Speaker A
We sweep this sellside liquidity here and create a fair value gap. So, let's see what happens here if we reach for this weekly fair value gap.
Speaker A
We get a nice full-bodied up-close candle into this point of interest. So, if we close below it, I would like to see it become an order block. There we get a close below it. So, I'd want to see the opening price of this support price lower. So, we get a move up to retest this area and this placement lower. Let's see what happens next.
Speaker A
over this high, I'd like to see this candle become an order block. So we do get a close over this. So marking out the opening price, I want to see this support price higher.
Speaker A
We sweep this sell-side liquidity here and create a fair value gap. So, let's see what happens here if we reach for this weekly fair value gap.
Speaker A
Price reaches into this order block gets displacement out. So now my eyes are drawn to where these areas of buyside liquidity.
Speaker A
So we do reach for the weekly fair value gap, as this daily fair value gap supports price lower. Now, what do we notice? We have a point of interest. We swept this low. So if we get a close over this high, I'd like to see this candle become an order block. So we do get a close over this. So, marking out the opening price, I want to see this support price higher.
Speaker A
prices higher. So let's go to our next example. For this next example we are going to be looking at NQ on the 5minute chart. To start out we have our daily level or important level here which is sellside liquidity from the daily chart
Speaker A
Now we have overlapping PD arrays, as we have a fair value gap and an order block lined up. Price reaches into this order block, gets displacement out. So now my eyes are drawn to where these areas of buy-side liquidity.
Speaker A
Now, what I don't really like is I prefer a nice full bodied candle down into this low. But let's see what happens.
Speaker A
And there we go. Oil makes a move higher to these previous highs. So you can see how these full-bodied up-closed candles here, when they get closed below, support price lower, and these down-closed candles, when they get closed above, support price higher.
Speaker A
lower time frame sweep with a full bodied candle. So I want to see if price can displace and close over this high.
Speaker A
So let's go to our next example. For this next example, we are going to be looking at NQ on the 5-minute chart. To start out, we have our daily level, or important level, here, which is sell-side liquidity from the daily chart here. So let's drop into the five-minute chart.
Speaker A
And see we now have a fair value gap below us as well. So we may reach into that.
Speaker A
So, here we are on the five-minute chart, and we just hit that daily swing low. So, what I want to see is, do we get displacement back up here? Now, what I don't really like is, I prefer a nice full-bodied candle down into this low. But let's see what happens.
Speaker A
time frame. after engaging with a higher time frame level, we get displacement and closure over the series or in this case this singular down close candle and then it is used as support to move higher. So for our last example, we're
Speaker A
So, we get a move up, but not very much displacement, right? We can't break these highs. So, let's see what happens there. We get a nice full-bodied down-closed candle, and we get a sweep. So now we have a lower time frame sweep with a full-bodied candle. So I want to see if price can displace and close over this high.
Speaker A
that we have a fair value gap here. But in the context of this video, what are we looking for? Well, we have a swing high here.
Speaker A
So there is displacement and closure over that high. So now I'd want to see if this opening price of this down-close candle, in the move that swept the lows, supports price higher.
Speaker A
what? An order block. So now we have a point of interest. So let's drop down to the 4hour time frame and watch what happens when price reaches that area. So here we get a move higher up into this order block. We
Speaker A
And see, we now have a fair value gap below us as well. So we may reach into that. We do reach into that. If you notice, the wicks reach into there, the body is still respecting this down-close candle, and price starts to reach higher. So you can see this down-close candle in the move that swept the lows on the lower time frame, after engaging with a higher time frame level, we get displacement and closure over the series, or in this case, this singular down-close candle, and then it is used as support to move higher.
Speaker A
So right here we now get our lower time frame sweep. So let's see if we can close below these up close candles. and ideally this low here.
Speaker A
So for our last example, we're going to take a look at gold on the weekly time frame and drop down to the 4-hour time frame. So if we're looking at the weekly time frame here, what do we notice? Well, it's pretty clear to see that we have a fair value gap here. But in the context of this video, what are we looking for? Well, we have a swing high here.
Speaker A
candles. Ideally I want to see a move below this low. But this is how I use it. So let's see what happens. And before I go any further, another thing I can do is use these moves to project.
Speaker A
And what happens? We get a move higher to sweep that. We can't close above these highs. And then we drop and close back below these lows. So these up-close candles on the move up that swept the highs before closing back below them is what? An order block. So now we have a point of interest.
Speaker A
Generally, I'd like to see a move towards this 2 to 2.5 standard deviation area and then eventually to this fourth standard deviation area. So, let's see what happens.
Speaker A
So let's drop down to the 4-hour time frame and watch what happens when price reaches that area. So here we get a move higher up into this order block. We haven't yet reached that weekly fair value gap. So let's see what happens. So we put in a swing high just below our point of interest.
Speaker A
and drag this out a little more. So, if you notice, we just hit our first standard deviation, but what did we also have a sweep here, a down close candle now closing over, I'd want to see the support price back up to this order
Speaker A
So right here we now get our lower time frame sweep. So let's see if we can close below these up-close candles, and ideally this low here.
Speaker A
and displacement lower. So what do we also have here now? up closed candles in the move that swept the high before we come and close below.
Speaker A
So we get a strong, aggressive move here. So what am I going to do here? Mark out these up-closed candles here as an order block, because we swept this swing high, and then we close below these up-close candles. Ideally, I want to see a move below this low. But this is how I use it. So let's see what happens.
Speaker A
Well, you can see how these two standard deviation projections are kind of overlapping. So, I'd want to see price reach into this area. So, let's see.
Speaker A
And before I go any further, another thing I can do is use these moves to project. So, if you haven't seen my video on standard deviation projections, I would use this manipulation leg to project it. Generally, I'd like to see a move towards this 2 to 2.5 standard deviation area, and then eventually to this fourth standard deviation area.
Speaker A
Looks like we might be headed back for this order block. So, we go hit this order block.
Speaker A
So, let's see what happens. So, we get that close below. So, that's our market structure shift. And if you notice, price did already use that order block, and it supported it lower. So, let's see what happens and drag this out a little more.
Speaker A
Still uses it as support to move lower. And then we go hit our rejections here.
Speaker A
So, if you notice, we just hit our first standard deviation, but what did we also have? A sweep here, a down-close candle now closing over. I'd want to see the support price back up to this order block. There we go. And see how the bodies respect it. Now we get a move up into that order block. Do we get any closes or displacement lower? No, not yet. Now we get a lower time frame sweep and displacement lower.
Speaker A
And where do we go? Back up to where you can see we have a high that was swept up close candle in the move that swept the high.
Speaker A
So what do we also have here now? Up-closed candles in the move that swept the high before we come and close below.
Speaker A
using these order blocks and the move that swept these highs can be used. So, I hope this video was helpful. If you did find it helpful, please consider liking and subscribing. And if you have any new ideas for videos, please drop
Speaker A
Once again, we can use this as a market structure shift. And if we want to, again, we can project from this high to this low. So, where do I want to se
Topics:order blocksICT conceptsfair value gapliquidity sweepmarket structure shiftreversal patternprice actionsmart money conceptstrading strategyDXY
![Intro To TTrades Fractal Model [Indicator & Settings] — Transcript](https://i.ytimg.com/vi/CqMIh-Vvhbg/maxresdefault.jpg)


![Change In State Of Delivery [CISD] – Orderblock Formation – ICT Concepts — Transcript](https://i.ytimg.com/vi/CHIK5oBRKiw/maxresdefault.jpg)