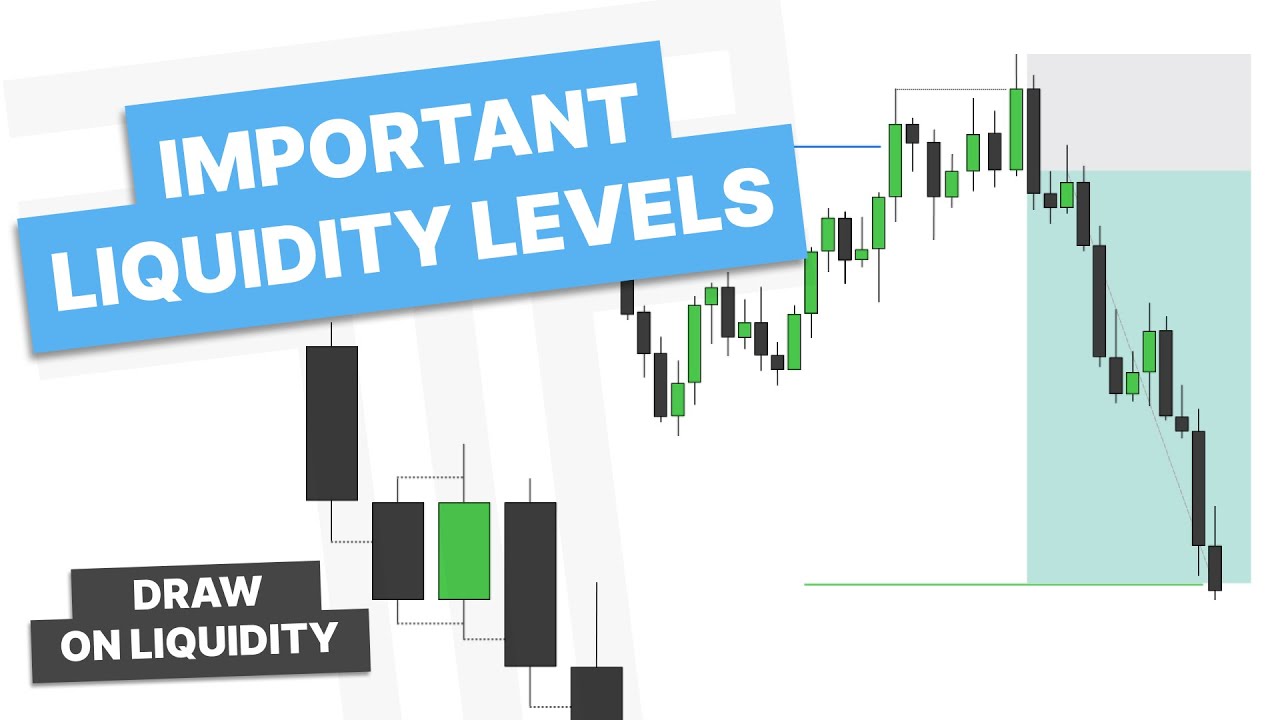
TTrades explains how to confirm the high or low of the daily candle using change in state of delivery (CISD) or candle closures, adjusting timeframes to session volatility across Asia, London and New
Key Takeaways
- Confirm the daily wick with a change in state of delivery or a candle closure rather than assuming it has formed.
- Match confirmation timeframe to session volatility: higher timeframes in Asia, lower in New York.
- Wait for structure to confirm; premature entries on a perceived low often get swept further.
- Even mechanically valid confirmations can fail if the directional bias is wrong.
What the video covers
- Introduces daily profile and intraday reversals: confirming whether the daily candle's wick (high or low of day) has formed.
- In a bullish scenario, price should open, form a low, then trade higher; the key is knowing when that low is in.
- Two confirmation methods are presented: change in state of delivery (CISD) and candle closures.
- CISD timeframe should match session volatility: hourly CISD in lower-volatility Asia, M15/M30 in London, and 5-15 minute CISD during New York.
- Candle closures use higher timeframes (4-hour) early in the day and lower timeframes (hourly, sometimes 30-minute) during New York manipulation.
- A candle two or candle three closure at a point of interest, relative to daily equilibrium, is used as confirmation.
- Practical chart examples on TradingView walk through waiting for confirmation rather than assuming the wick is in.
- Targets are discussed as around the daily open, with risk expressed in R multiples (2R to 3R).
- A warning is given that a wrong directional bias can still lead to a mechanically confirmed but incorrect wick.
- Divergence (SMT) between ES and NQ is cited as additional confirmation of a range low.
Chapters
- 00:00Introduction to Daily Profile and Intraday Reversals
- 01:29Using Change in State of Delivery by Session
- 02:54Using Candle Closures and New York Manipulation
- 04:18Recap of Timeframe Selection
- 04:38Chart Example: Bullish Setup and Waiting for the Wick
- 07:35Entries, Targets and Continuation Structure
- 13:20Handling Wrong Bias and SMT Divergence
- 16:40Closing Examples and Final Thoughts
Full Transcript — Download SRT & Markdown
Speaker A
How's it going everyone, and welcome back to another video. In this video, we are going to talk about understanding daily profile or intraday reversals.
Speaker A
Essentially, how do you confirm the wick of the daily candle or confirming the higher day or lower day. So, the way I'm going to confirm the wick of the daily candle or in this case if we are bullish, we want to see price open, make
Speaker A
Essentially, how do you confirm the wick of the daily candle or confirm the higher day or lower day? So, the way I'm going to confirm the wick of the daily candle, or in this case, if we are bullish, we want to see price open, make a low, and then trade higher. How do I understand when this low has been formed, or when the low of the daily candle has been formed, and then I can look to trade it away?
Speaker A
I'm going to either use candle closures or a change in the state of delivery.
Speaker A
I'm going to either use candle closures or a change in the state of delivery.
Speaker A
I can use a change in the state of delivery within any session, but with that I want to adjust the time frame I use based off the volatility. Asia is less volatile than New York, so I'm going to use a higher time frame. So, if
Speaker A
So, let's talk about each. When can I use a change in the state of delivery?
Speaker A
away. Now, if I'm looking for London to form the high or low of the day, there is a little bit more volatility than Asia during London. So, I can use a slightly lower time frame.
Speaker A
I can use a change in the state of delivery within any session, but with that, I want to adjust the time frame I use based off the volatility. Asia is less volatile than New York, so I'm going to use a higher time frame. So, if I'm looking for this wick to form in Asia, I'm going to focus on an hourly change in the state of delivery to confirm that high or low of day on the daily candle, or that wick. Once that forms, then I could look to trade it away. Now, if I'm looking for London to form the high or low of the day, there is a little bit more volatility than Asia during London. So, I can use a slightly lower time frame.
Speaker A
delivery. It just doesn't always occur. For instance, if we go to New York, this is where I can use a 5-minute or 15-minute change in the state of delivery cuz price is very volatile and fast around the New York stock market
Speaker A
So, this would be using a 15-minute or 30-minute change in the state of delivery. Now, you might ask, can't I also use an hourly change in the state of delivery? Yes, you can always use a higher time frame change in the state of delivery. It just doesn't always occur. For instance, if we go to New York, this is where I can use a 5-minute or 15-minute change in the state of delivery, because price is very volatile and fast around the New York stock market open. It doesn't mean you can't use an hourly change in the state of delivery if it has already occurred. It's just generally, given the volatility, if you wait for that hourly change in the state of delivery, price will leave you behind. So, that's how I would use a change in the state of delivery to confirm that higher day or lower day.
Speaker A
behind. So, that's how I would use a change in the state of delivery to confirm that higher day or lower day.
Speaker A
But, I can also use candle closures, right? We can have this change in the state of delivery, but I could also use a closure. So, how do I go about using that? As you've seen in my previous video, you can use multiple different time frames for this, such as the 7-hour, but I want to use the 4-hour or 1-hour generally. Now, if I'm in Asia or London, or even New York, I would prefer to use the 4-hour candle, specifically in the early parts of the day, because the volatility is lower. I can use a 4-hour candle closure paired with my lower time frame fractal model to confirm that lower day or higher day.
Speaker A
time frames for this, such as the 7-hour, but I want to use the 4-hour or 1-hour generally. Now, if I'm in Asia or London or even New York, I would prefer to use the 4-hour candle, specifically in the early parts of the day, because
Speaker A
All right, and so I'm just looking for a candle two or a candle three closure, ideally at a point of interest, but mainly in respect to the daily equilibrium. And then I can look to trade that away.
Speaker A
All right, and so I'm just looking for a candle two or a candle three closure, ideally at a point of interest, but mainly in respect to the daily equilibrium. And then I can look to trade that away.
Speaker A
Now, once I'm into New York, the volatility has increased, and that's where I can use a lower time frame candle closure. So, really in New York, and this is generally with a New York manipulation, I can use an hourly candle closure, sometimes even a 30, but generally an hourly closure. Find a candle two closure or a candle three closure at a point of interest, and then look to trade that away. Generally, what this looks like is some sort of opposing move at 9:30, then at 10:00 a.m., when the candle opens, that 9:00 to 10:00 a.m. candle is a candle two closure, and we can look to trade the 10:00 a.m. C3 candle.
Speaker A
closure, sometimes even a 30, but generally an hourly closure, find a candle two closure or a candle three closure at a point of interest, and then look to trade that away. Generally, what this looks like is some sort of opposing
Speaker A
So, just to go back and review, we can use a candle closure or a change in the state of delivery to confirm that higher or lower of the day.
Speaker A
candle closure or a change in the state of delivery to confirm that higher or lower of the day.
Speaker A
If we are in the lower volatility sessions, we're going to want to use those higher time frames. All right, so in Asia, I want to use an hourly change in the state of delivery or a 4-hour candle closure. In London, I'd want to use that M15 or M30 CISD or a 4-hour candle closure. In New York, that's really where we can adjust it, and we can use some lower time frames for candle closures, such as the hourly or the 4-hour for candle closure, or the 5-minute and 15-minute for a change in the state of delivery. Let's get into TradingView and go over a few examples of this.
Speaker A
use that M15 or M30 CISD or a 4-hour candle closure. In New York, that's really where we can adjust it and we can use some lower time frames for candle closures such as the hourly or the 4-hour for candle closure or the
Speaker A
So, here we are in our first example, and you can see we have a candle two closure here on the daily chart and a nice V-shape reversal and then a consolidation. We have these failure swings on the high.
Speaker A
So, here we are in our first example and you can see we have a candle to closure here on the daily chart and a nice V-shape reversal and then a consolidation. We have these failure swings on the high.
Speaker A
So, everything is set up here for a bullish move, but what are we looking for? Right, we are trying to let this daily candle reach down, open low, form its wick, right? And then it can flip and then go bullish, right? So, we're just wanting to let price come down here, tell us that it's formed its daily wick, and then we can look to trade it higher.
Speaker A
just wanting to let price come down here, tell us that it's formed its daily wick, and then we can look to trade it higher.
Speaker A
So, if you remember, we are either going to do this using a change in the state of delivery based off the session or a candle closure. So, I'm just going to continue, right? I'm on the hourly chart here. Do I think that this daily candle has formed its wick? Do I think this low is in? No. I'm going to go ahead and continue along. Do I think this daily candle has formed its wick? No, right? And it's a little bit of a deeper run. We don't want to see a close below the EQ.
Speaker A
Do I think that this daily candle has formed its wick? Do I think this low is in? No. I'm going to go ahead, continue along. Do I think this daily candle has formed its wick? No, right?
Speaker A
Do I trust that this has formed its daily wick? Now, you might see this candle closure here and say, "Yeah." But for me, I'm not really going to trust this doji candle here after a large move down. This is expansion. This is more of a consolidation. I'm not going to trust an hourly candle closure here in the early parts of the day, or near Asia. We're going to let this continue.
Speaker A
Do I trust that this has formed its daily wick? Now, you might see this candle closure here and say, "Yeah." But for me, I'm not really going to trust this doji candle here after a large move down. This is expansion. This
Speaker A
And see, that's a retracement. Do we make a new low? We do, right? Now, am I going to trust this candle closure? Right? And still, no, right? We're in London now, approaching London open, but no, I'm not going to trust this, because it's just hard to trust an hourly candle closure that early into the day, right? I want to have more confirmation from a 4-hour candle closure. So, let's take a look at the 4-hour candle closure.
Speaker A
And see that's a retracement. Do we make a new low? We do, right? Now, am I going to trust this candle closure?
Speaker A
Right? I don't trust that. That's not convincing. So, going back to the hourly, I just need to let another candle form. I don't trust this wick has formed on the daily candle.
Speaker A
confirmation from a 4-hour candle closure. So, let's take a look at the 4-hour candle closure.
Speaker A
And then right here, now we have another candle closure. This one is a little bit more convincing, but I'm still not going to trust that until I have a 4-hour candle closure or an hourly or lower time frame change in the state of delivery. Here I could possibly go to the 30-minute and look for a change in the state of delivery. Right? That is possible here because we are in London. So, we could do that. Let's see if we get that.
Speaker A
And then right here, now we have another candle to closure. This one is a little bit more convincing, but I'm still not going to trust that until I have, you know, a 4-hour candle closure or an hourly or lower time frame change in the
Speaker A
Right? And we do take out the low and have this change in the state of delivery. So, this is the first possible time where I could say, "Hey, there's potential for this to form the low of the day." But, normally I want to pair that with other confluences. So, let's go back out to the hourly time frame.
Speaker A
That is possible here because we are in London. So, we could do that. Let's see if we get that.
Speaker A
We have a nice candle closure here on the hourly. Take a look at the 4-hour. Has it closed yet? Nope, hasn't closed yet. We've got to wait for six. So, I could potentially consider the low of the day with that 30-minute change in the state of delivery. If I want more confirmation in the earlier part of the day, what am I going to be looking for? That 4-hour candle closure or the hourly change in the state of delivery. Those are my favorite for pre-New York. So, what do we have here?
Speaker A
pair that with other confluences. So, let's go back out to the hourly time frame.
Speaker A
We don't close over that yet. And we have one more hour until that 4-hour candle closure. So, let's give it one more hour. What do we have? We have this closure over. Let's check the 4-hour chart.
Speaker A
Has it closed yet? Nope, hasn't closed yet. We got to wait for 6. So, I could potentially consider the low of the day with that 30-minute change in the state of delivery. If I want more confirmation in the earlier part of the
Speaker A
We have a 4-hour candle closure, as you can see here. So, now what do we have? Now we have that 4-hour candle closure and hourly change in the state of delivery. So, both of those are checked off. So, now I have a lot more confirmation that this low could be the wick low of the daily c
Speaker A
We don't close over that yet. And we have one more hour until that 4-hour candle closure. So, let's give it one more hour. What do we have? We have this closure over. Let's check the 4-hour chart.
Speaker A
We have a 4-hour candle to closure, as you can see here. So, now what do we have? Now we have that 4-hour candle closure and hourly change in the state of delivery. So, both of those are checked off. So, now I
Speaker A
have a lot more confirmation that this low could be the wick low of the daily candle than I did right at that low. And so, you can see how we use that candle closure plus the change in the state
Speaker A
delivery. So now, if you can anticipate this to have formed the wick low of the day, what can you do now? Well, you could look for a fractal model. So right here, we have 4-hour candle closure. We could go to the 15-minute time frame and
Speaker A
look to trade this higher, right? With this continuation that's formed right here. Or we could also just enter on this higher time frame here. So we could go ahead and enter on this hourly time frame. My stop on the low of the day and
Speaker A
then look for 2R. And maybe that's too far of a target. You want to be targeting around the daily open. And that's where you could use the lower time frame or the 15-minute for this continuation in here, right? And that will get you 2R right
Speaker A
around that daily open. But either of those can work and either are possible. As we let this play ahead, what happens? We get a nice move higher into those failure swings on the side.
Speaker A
So, what can we learn from this? We want to ask ourself as we go throughout the day, "Has the daily candle formed its wick?" That's the one question to remember. So we go through this, there's nothing we can trust yet. We have a
Speaker A
little bit of confirmation here in London with a 30-minute change in the state delivery, but it's not until we get this hourly change in the state of delivery and that 4-hour candle closure here where we could say, "Hey,
Speaker A
if the daily candle's going to form its wick here and we're going to remain bullish, this is where it would be." Right? And that is where you can look to get on side or look to trade, right?
Speaker A
Because we want to let the wick form and then look to trade the body of the candle or that expansion following. So let's get into another example. So here we are in another example. You can see we have a nice candle to closure here on
Speaker A
the daily chart. This is not yet paired with a change in the state of delivery, but we do have a nice V-shape, right? We have a fair value gap here and a fair value gap here. But without that change
Speaker A
in the state of delivery, we're going to need that intraday confirmation. So if we are bearish, what do we want to see?
Speaker A
Price open, trade higher, form its daily wick, right? We want to see this wick form, and then some sort of confirmation that confirms that wick for us, and then we can look to trade it away and lower.
Speaker A
So, let's get into this. We're just going to ask ourselves that same question. Do I trust that this has formed its daily wick? Well, the fact that we don't even have a wick yet, no.
Speaker A
So, I can't do anything. Right? Do I trust this has formed its daily wick? Nope. So, I'm going to let another candle print.
Speaker A
I'm just going to keep doing this until I have some sort of confirmation. Now, we are in Asia here, so what are my options? I can look for an hourly change in the state of delivery or a 4-hour
Speaker A
candle closure. It's really unlikely we're going to get that hourly change in the state of delivery cuz it's all the way down there, but we could look to see if we get a 4-hour candle closure.
Speaker A
Let's see here. Right? Do I trust that this has formed its wick yet? Well, we are starting to get an aggressive move lower, right? Expansion candles. So, what could I look for that?
Speaker A
If I'm in Asia, my only options are what? 4-hour candle closure or hourly change in the state of delivery.
Speaker A
Here you can see, we do actually have that 4-hour candle closure. So, I could use this and consider it a potential high of the day or this forming the wick high. So, what would I want to do if I'm looking to trade that?
Speaker A
Well, I could look to just take an entry with my stop on that high of the day that I think is in, right? And then looking for my 2 to 3R depending on your targets, or I can use a 4-hour and 15-minute fractal
Speaker A
model, right? And we have What do we have? The change in the state of delivery right there, and then look for a continuation lower.
Speaker A
So, either of those would work, but the whole point of this video is trying to explain when the high or low of the day has formed. We have lots of other videos on entries. Let's see what happens.
Speaker A
Right? And we get this move lower. So, either would have worked. You see how that 4-hour candle closure in Asia can potentially form the high or low of the day.
Speaker A
You can see we get a retracement move back up. We're closer into New York now.
Speaker A
And so, we could be looking for continuations in that direction. And this is where bias and profile comes into line. A lot of people will see this move here and get scared. Well, we just know that our bias remains intact if
Speaker A
this high of the day that we are trading away from remains intact, which it does.
Speaker A
So, we can continue to keep that bearish bias reaching for an expansion lower. So, this is an example of a 4-hour candle closure in Asia forming that high of day. So, here we are in another example. Once again, a candle two
Speaker A
closure. This one we have a change in the state of delivery. And what do we notice? We've already kind of formed another continuation here.
Speaker A
So, what are we not wanting to see? We don't want to see price trade over this high, right? Cuz that'd be invalidating this area here, and that's not bearish anymore.
Speaker A
So, we want to see price open, make some sort of high, and then we can look to trade it away. Once again, what are we going to ask ourselves? Has the daily wick formed, right? So, I do not think
Speaker A
that yet, right? We don't really have any wick there. So, it's hard for me to trust it unless we break lower and then get another continuation, which we can talk about.
Speaker A
Right here, I still don't trust anything, right? We haven't even formed a daily wick. So, there's nothing to be looking for in here, right? What time frame are we approaching? We're working our way into London here.
Speaker A
And what do we have? A reach into this fair value gap right here, right? Which is where we want to see that wick high form, right? Because we don't want to see it break through 50% of these opposing
Speaker A
candles or invalidate our idea. And we have a candle two closure here. Now, I generally, like I said, don't use hourly candle two closures earlier into the day. I want to see an hourly change in the state delivery or a 4-hour candle
Speaker A
closure. So, what are we going to wait for? Hourly change in the state delivery.
Speaker A
Let's see what happens. We get that closure through. So, now I could ask myself, do I think that the daily wick has formed? And I could say yes, because I have that structure on the lower time frame to tell me that I
Speaker A
think this wick has formed. So, I could look to either get on side on this time frame or look to a lower time frame fractal model in line with that. And now, since we have 6:00 a.m. opening, we
Speaker A
could also check out the 4-hour candle here. What do we have? We also have a 4-hour candle to closure. So, we could also trade this on the 15-minute time frame.
Speaker A
So, we have that confirmation again. An hourly change in the state delivery with a 4-hour candle closure. Go back to the hourly time frame just to view it. So, we could anticipate this to hold if we're going to continue to trade this
Speaker A
lower. Letting that expand, we get that expansion lower. You can see how that 6:00 to 10:00 a.m. candle has that expansion lower. If you go to the 15-minute, that's a 4-hour and 15-minute fractal model. So, if we go ahead,
Speaker A
switch our settings here to automatic, it'll switch to the 4-hour and 15-minute model. And you can see, what do we do?
Speaker A
We form a continuation right in there. And so, that is a potential to sell off there.
Speaker A
So, let's get into another example. Now, I quickly want to talk about why bias is so important.
Speaker A
If you have a wrong bias, you can mechanically confirm the wick high or wick low of the day and still be wrong.
Speaker A
So, for instance here, if you are bearish, right? What do we have? We have London sweeping out the high, forming a change in the state of delivery. It's valid if you're bearish to trust this high to remain and look
Speaker A
for it to continue lower. Right? Because in London, we can look for that hourly change in the state delivery or a 4-hour candle closure, right? Which we also have.
Speaker A
Right? And so, it's valid to be bearish, you know, expecting that high to remain. Now, if you have the wrong bias, right? Which you can see it's wrong here on the higher time frame, you do get the low
Speaker A
taken out, right? So, it was the correct bias to the current day's low. But, when you have the wrong bias, it's going to get ran out. So, that is a quick lesson that I wanted to talk about because you
Speaker A
may not be doing anything wrong on the lower time frames here. It's just that your bias was wrong, and that's okay.
Speaker A
You just have to accept that you're not always going to be right all the time.
Speaker A
But, let's use this example to also talk about what can you do in New York, right? And so, here you can see we have more of a consolidation. We have this range high gets taken out. It goes to the range
Speaker A
low. And what do we also have at that range low? Right? We have SMT. You can see ES doesn't take out the low, while NQ does take out the low.
Speaker A
So, if I was bullish on the day, right? Using the higher time frames, what would I want to look for in New York? Well, since New York is a lot faster, I can use an hourly candle closure, right? So,
Speaker A
looking at this SMT, since this is the one that made the higher low, I can focus on that. I could use this hourly candle to closure to potentially confirm the low of the day, right? Or, in this case, NQ took it out,
Speaker A
so NQ's forming its low, but an area to trade away from. So, I can look for that. Now, if you notice, if I wait for that 4-hour closure, right?
Speaker A
It's already expanded quite a bit. Yes, it continues, but if I wait for that 4-hour closure or this hourly change in the state delivery, a lot of times I'm a little late for the move. In this case, it did come back and retest that area,
Speaker A
but that's what I'm trying to explain. New York brings volatility. We can use the lower time frames. So, here I could use the hourly candle closure, look for an lower time frame fractal model there, or you can also look for a 15-minute
Speaker A
change in the state of delivery, right? Or a 5-minute change in the state of delivery. Here, it's actually not super clean, right? So, maybe I will go to the 5-minute, see if that cleans up the structure. It does, right? And so, this
Speaker A
would be that hourly and 5-minute fractal model. Let's go ahead and rewind it, so it makes a bit more sense.
Speaker A
Turn this on automatic. And you can see, right? That candle to closure, we reach lower, we then form a continuation, and I could look to trade that higher. Now, that's what I'm going to do if the 15-minute isn't clean,
Speaker A
right? I can either refine it down with a candle closure in a lower time frame, or I could go up a time frame and see if the 30-minute sorts it out a little bit better, right? In this case, New York is
Speaker A
so fast that if you notice that you're waiting for this closure, it's almost already to those highs. So, this is just an example and a little lesson that bias does matter, right? It's going to matter within the intraday profile. And that
Speaker A
was just a lesson that bias does matter, right? You can be completely right in how you mechanically confirm the high or low of day, but just be wrong on your bias. And also, when you are in New York, the volatility does increase, and
Speaker A
a lot of times that requires you to use lower time frames or a lower time frame fractal model. So, for instance, in that example, we're using an hourly candle closure, 5-minute change in the state of delivery, or a 15-minute change in the
Speaker A
state of delivery. Let's get into another example. So, now that we've gone over most every example using an Asia higher or lower day, London higher or lower day, and even one of a New York higher or lower of day, let's take a look at today's
Speaker A
example, cuz it's quite complex. So, those previous examples are pretty straightforward, but not every day is going to be straightforward, right? So, let's take a look at today. What do we have, and what do we have when we get
Speaker A
into the New York session? Let's go ahead, we'll rewind it here, and take a look. Right? If we were bullish on today, what would we want to see? We'd want to see price open, respect the EQ, right? Probably get a
Speaker A
shallow sweep of that, confirm the low of the day, and then look to trade it higher. But, what do we notice? Price opens and immediately breaks down. And this is what I was talking about in the previous example,
Speaker A
is I can't really trust this high right away to trade away from, but once it breaks down, I can then trust that the bias has been invalidated to the bullish side, and I can trade it lower. So, if
Speaker A
you remember when I talked about invalidation days or using EQ for bias, when we break down through this level, as long as we remain below it, I can remain bearish. So, here we have this breakdown.
Speaker A
If I'm wanting to confirm the high or low of the day, which we have up there, but if I'm wanting to confirm a high or low to trade away from, in this case a high, what am I going to want to look
Speaker A
for? Well, in London, right? I could look for a continuation. I'm not going to use a candle closure in London. So, I could wait for this change in the state of delivery or continuation to form.
Speaker A
And what am I looking for? A closure through there. Do we get that? No, and it takes too long. So, this is becoming a consolidation.
Speaker A
You may remember this from why my why continuations fail video, right? And what are we looking for? A sweep of this high, right? Because if there's a consolidation, we want to see a sweep of a high to trade it lower.
Speaker A
So, if that's what we're looking for into New York, what are we looking for?
Speaker A
Ideally an hourly candle closure or a 15-minute or 5-minute change in the state of delivery.
Speaker A
So, as we let this approach, what do we have? We have this move that fails to reach up to there. Now, this is okay. It's the weakest asset. If we go ahead and take a look at ES, ES is taking out that same
Speaker A
high. So, what does that mean? It means that we have an SMT here. So, we have an SMT forming a continuation in this candle to closure, Right? So, what could I look for in this next candle at 9:00 for it to trade
Speaker A
lower, right? And so, this is an example where it's hard to trust this high of the day early on, right? At least for me. I would not catch this move. But now that the chart is basically telling me
Speaker A
that it's bearish and we're having a consolidation here, which is a continuation signature, we have an SMT that's basically confirming the high of the day that I can trade away from, right? A high of the session, something like that. So, with this, I'd want to
Speaker A
let the, you know, either open print, right? So, if I'm on the 15-minute chart here, if I'm taking entries pre-open, I usually want to use the 15-minute chart.
Speaker A
That allows me to not get, you know, so sucked into the lower time frames. So, I could wait for a 15-minute closure below here and see if that happens before 9:30, right? And then I could put my stop on
Speaker A
the high or I could wait for 9:30 to open and print and then look to get on side on something like a 5-minute time frame, right? So, if we go take a look at the 5-minute time frame here, let's go ahead
Speaker A
and mark out 9:30. It's right in there. So, we want to let 9:30 print and then look to trade it lower if we can.
Speaker A
Right? So, why wouldn't I trust this right here? Well, I'm not trusting these 5-minute um entries pre-market because a lot of times they get swept out, right?
Speaker A
I want to use a 15-minute. Now, if the 15-minute closes below here, it's very possible that if I want to take an entry, I can enter on the close or the retest, put my stop on that high, and then look for a continuation lower.
Speaker A
If I'm going to take a pre-market entry, that's how it looks for me. If I'm looking for a lower time frame entry, I'm going to look after the open, right?
Speaker A
So, how does that work on the 15? It works out pretty well, right? Let's go back, take a look at the 5-minute.
Speaker A
How does that work, right? On the 5-minute, I want to let it open, see if we have a new continuation.
Speaker A
Here, you can see very fast. This is maybe where I drop down to something like a 3-minute, right? And we have that closure through.
Speaker A
I could look for that entry, but it's quite a large stop loss, so maybe I let a new continuation form.
Speaker A
Right? And right there, do we get a closure below this level? We do. Then I could look for a new continuation somewhere in here. My stop above that high, looking for two R.
Speaker A
Right, and that's a breakdown type of entry. So, let's see what happens. Right there, another entry formed.
Speaker A
Basically, two more entries. You wait for that new candle open right there. Take this secondary entry as well.
Speaker A
Basically, any of those entries work once we're trending. But, the whole idea of this video is not about entries. What is it about? Confirming higher low of day and confirming highs and lows that we can trade away from. So, this is not
Speaker A
technically the high of the day. The high of the day is up there, but we are confirming this, treating it like the high of the day because we're trying to find a high to trade away from. Once we
Speaker A
find these levels, that is where I can look to take entries because I have somewhere to trade away from. Now, I hope this video was helpful. If you have any questions, comments, leave them in the comment section below, and I'll get
Speaker A
to them when I can. But, with that, thanks for watching. Like and subscribe, and I'll see you guys in the next one.
Topics:daily profileintraday reversalchange in state of deliveryCISDcandle closureICTsession volatilityNew York openSMT divergenceTradingView
![Intro To TTrades Fractal Model [Indicator & Settings] — Transcript](https://i.ytimg.com/vi/CqMIh-Vvhbg/maxresdefault.jpg)


![Change In State Of Delivery [CISD] – Orderblock Formation – ICT Concepts — Transcript](https://i.ytimg.com/vi/CHIK5oBRKiw/maxresdefault.jpg)