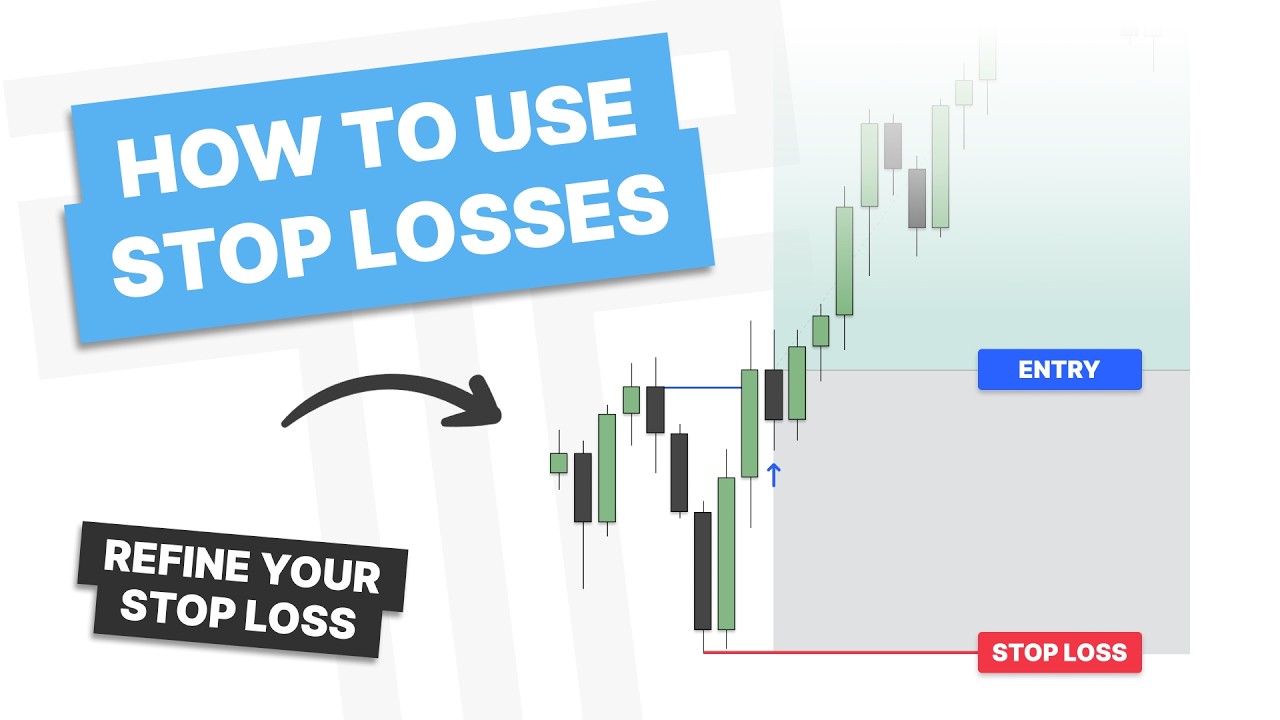
TTrades explains the New York reversal in ICT daily profile trading: London fails to reach a higher time frame PD array, so New York retraces to it, forming the reversal with a change in delivery.
Key Takeaways
- A New York reversal forms when London fails to reach a relevant higher time frame PD array, requiring New York to retrace into that level
- A change in the state of delivery, such as a series of closed candles, confirms the reversal and signals entry
- Liquidity pools such as previous day highs and lows act as targets and reasons for the move
- Lower time frame confirmation (15-minute or 30-minute charts) helps validate the setup
What the video covers
- Part two of a daily profile series on ICT concepts, following a London reversal video
- Defines the New York reversal as an open-high-low-close or open-low-high-close pattern forming after London fails to reach a relevant higher time frame PD array
- Explains that in a bullish New York reversal, London moves lower without reaching a key higher time frame level, then New York retraces into that level
- Uses a change in the state of delivery (series of down-closed or up-closed candles) as the trigger for entry
- Discusses entering after a close over the order block, with stops on the low and targets at failure swings and buy-side or sell-side liquidity
- Demonstrates examples on TradingView using previous day lows as sell-side liquidity and previous highs as external liquidity targets
- Covers how fake changes in state of delivery can occur to purge lows before the true reversal
- Examines a range-based example trading off external liquidity with London and New York sessions as manipulation and continuation phases
- Highlights the 8:30, 9:30 and midnight time levels as relevant for timing entries and partials
- Emphasizes risk-to-reward considerations and taking partials at roughly 2R or higher
Chapters
- 00:00Introduction to the New York Reversal series
- 01:15Defining the New York reversal pattern
- 02:20Bullish and bearish New York reversal examples
- 04:00Trade framing and targeting liquidity
- 05:30Identifying false London reversals
- 07:10Range-based external liquidity example
- 10:00Daily profile analysis and time-level entries
- 12:30Wrap-up and higher time frame objective
Full Transcript — Download SRT & Markdown
Speaker A
how's it going everyone? This video is going to be part two in my daily profile series, and it will be focused on New York reversal. Now, if you haven't already watched part one in this series, make sure to go check that out, which was focused on London reversal. Let's get into the PDF and get started.
Speaker A
be focused on London reversal let's get into the PDF and get started so here we are in the PDF and this is the sessions or the kill zones so you can see we have Asia London New York a. and then New
Speaker A
So here we are in the PDF, and this is the sessions, or the kill zones. You can see we have Asia, London, New York AM, and then New York PM. We are going to filter that out to just focusing on London, and then the New York AM session. I will specifically be focusing on London and then New York AM for the indices.
Speaker A
to be a candle that looks similar to this we'll have an open high low close and then open low high close how this differs from a London reversal is that London never reached a relevant PD aray so when it went open high into London we
Speaker A
So what is the New York reversal? Well, it's going to be a candle that looks similar to this. We'll have an open, high, low, close, and then open, low, high, close. How this differs from a London reversal is that London never reached a relevant PD array. So when it went open high into London, we never reached a PD array to form the reversal, so then we go higher until New York to form the reversal.
Speaker A
a relevant higher time frame level we continue to retrace into New York where we reach that higher time frame key level then we have the change in the state of delivery and then the move higher similarly with the bearish New
Speaker A
So here we are with a bullish New York reversal. You can see London moves lower, never reaches a relevant higher time frame level. We continue to retrace into New York, where we reach that higher time frame key level. Then we have the change in the state of delivery and then the move higher. Similarly, with the bearish New York reversal, London retraces. In New York, we hit that higher time frame key level, have the change in the state of delivery, and then we continue lower.
Speaker A
trading View and the level I'm going to Mark out here is this previous day low that will be our sells side liquidity if you notice here London we do reach lower and move higher but we never reach a
Speaker A
So let's hop into TradingView to go over a few examples of this. Here we are in TradingView, and the level I'm going to mark out here is this previous day low. That will be our sell-side liquidity. If you notice here, in London we do reach lower and move higher, but we never reach a relevant higher time frame level. As we get into New York, what happens? Well, we go and reach this higher time frame level. So now what am I looking for? A change in the state of delivery. Marking out this series of down-closed candles here, this would be our change in the state of delivery. Let's see what happens. We fail to change the state of delivery here, which gives me the indication we're going to move lower to either make a new low or at least down into this wick here. Let's see what happens. Here we make a new low.
Speaker A
candles here this would be our change in the state of delivery let's see what happens we fail to change the state of delivery here which gives me the indication we're going to move lower to either make a new low or at least down
Speaker A
So now where is our new series of down-close candles? Right here. You see how that also lines up with New York open, an important time level. So now let's see what happens here. We get the closure over. I would be looking to frame a trade after we close over. My stop could be on the low, but I'm just looking to target all these failure swings up here. That doesn't really make sense in terms of risk to reward, so I'll put it at the bottom of this order block here. Let's see how this works out. And there we go. We continue higher, taking out all these failure swings. So you can see it's bullish, and with London we just retrace lower into the higher time frame level at New York. That is what frames the New York reversal, and you can see, looking at all these highs up here, we have a bunch of low-resistance liquidity to run through. That is how we get that aggressive move after the change in the state of delivery.
Speaker A
important time level so now let's see what happens here we get the closure over so then I would be looking to frame a trade after we close over my stop could be on the low but just looking to Target all
Speaker A
Let's go ahead and look at another example. Here we are with our next example. Let's take a look. You can see in London we do form that low, so that looks like a London reversal, right? But wait, let's look to the left a little. Did we ever reach a higher time frame level? No, we are just creating more equal lows, or more liquidity, down here. This is going to be a fake change in the state of delivery to then run the lows again. When should this occur? Ideally around the New York opening times. But now that we've purged these lows down here, I'm looking left, and what do I see? Failure swing, failure swing, failure swing. We have all these highs lined up here. Now, what I can do is, if I know what I'm going to be framing, I know currently the M15 changing the state of delivery would be here, but I can also go down to a lower time frame to see what I see. Let's see what happens here. We get another run lower, so there's no setup yet.
Speaker A
swings so you can see if bullish and with London we just retrace lower into the higher time frame level at New York that is what frames the New York reversal and you can see looking at all these highs up here we have a bunch of
Speaker A
Okay, here you can see we sweep a low and can't close below it. That's at New York open, right? So New York open makes the opposing move. New York open would also be the order block that would be formed if we get a close over. Now, with this close over, I can look to take an entry, my stop on the low, and what am I targeting? Well, you see all these failure swings here and up there, so London and Asia highs. I could look to target there, take some off here, take some off at midnight. With such a high R trade, it doesn't really matter where I take partials as long as it's over two R for me. But here we hit midnight and we run through that high there. So you can see it looked like a London reversal, but we never engaged a higher time frame PD array. So then it is actually a New York reversal to run out these highs.
Speaker A
a look here you can see in London we do form that low so that looks like a London reversal right but wait let's look to the left a little we ever reach a higher time frame level no we are just
Speaker A
Let's go into another example. Here we are with our next example. Let's work this top down. What do you see here? We're currently respecting the lower half of this wick, and the consequent encroachment of it. What do we notice here? We close back inside the previous candle's high, and what do we form? A bearish reversal candle. Being bearish the next day, I want to see what open, high, low, close looks like. Let's go down to the 30-minute chart or the 15-minute chart to confirm this using daily profile.
Speaker A
now that we purge these lows down here I'm looking left and what do I see failure swing failure swing failure swing right so we have all these highs lined up here now what I can do is if I
Speaker A
So here we open the new day. Let's see what happens in London, right? That's what's important, between 2 and 5. Do we see London form a high here for a London reversal to continue lower? No, we do not, right? It is just trading higher. So as we get into the New York session, let's see what happens. We make a move higher, and we get displacement down. This series of up-closed candles here is a little messy. We can go out to the 30-minute. Here we have a series of up-closed candles. Mark that out. That is our change in the state of delivery intraday, or an order block. And what do we have resting here? Failure swings from Asia and London. I could look to take a trade here with either my stop on this high or above the order block, and then target this low for 2.65 R. Let's see how that works out. We can see midnight offering support here, and what just opened, 8:30. If we're going to get this move back up, I'd like to see at 8:30 making an opposing run to form a new order block right there. What do we see? Well, we get tagged in and hit our TP, but we also form a new order block. So let's see what happens here. We wanted to take another trade or just let it go. We'll just see how it works out. You see how it's also lined up with 8:30 and midnight, so we have quite a few overlapping confluences. And there we go. That would be our propulsion block, an order block built off an order block. But I hope you can see how we went through, realized it wasn't a London reversal because London is continuing higher. This important level we hit was forming the wick on the daily chart. You can see we didn't have a wick prior to that, and we reach in to this previous range. So then we use that to frame trades lower, getting the New York reversal for a continuation lower.
Speaker A
another run lower so there's no setup yet okay here you can see we sweep a low can't close below that's at New York open right so New York open makes the opposing move New York open would also be the order block that would be formed
Speaker A
Let's go through a couple more examples. In this next example, we're going to be talking about framing a trade off of external liquidity and then the continuation that follows. You can see here we have a range, and here is the range high. We can consider any of these for the range low, but I will use the most current swing low here. Dropping down to the next day, let's see what we can use with daily profile on this high. So here we are with the 15-minute chart. Let's see what happens. Here in London, what happens? Well, we sweep out this low and form a low, so likely to continue higher to this high. Now you can see New York open makes an opposing run and continues higher, and now we're taking all the liquidity from that previous day's high.
Speaker A
Asia highs I could look to Target there take some off here take some off at midnight with such a high R trade doesn't really matter where I take partials as long as it's over two R for me but here we hit midnight and we run
Speaker A
through that high there so you can see it looked like a London reversal but we never engaged a higher time frame PD array so then it is actually a New York reversal to go run out these highs let's
Speaker A
go into another example so here we are with our next example let's go ahead and work this top down what do you see here we're currently respecting the lower half of this Wick right and the consequent encroachment of it what do we
Speaker A
notice here we close back inside the previous candle's high and what do we form a bearish reversal candle so being bearish the next day I want to see what open high low close let's go down to the 30 minute chart or the 15minute chart to
Speaker A
confirm this using daily profile so here we open the new day let's see what happens in London right that's what's important between 2 to 5 do we see London form a high here for a London reversal to continue lower no we do not
Speaker A
right it is just Trading higher so as we get into the New York session let's see what happens make a move higher and we get displacement down this series of up closed candles here it's a little messy we can go out to the 30 minute here we
Speaker A
have a series of up closed candles Mark that out that is our change in the state of delivery intraday or an order block and what do we have resting here failure swings from Asia and London I could look
Speaker A
to take a trade here with either my stop on this high or above the order block and then targeting this low for 2.65 R let's see how that works out can see midnight offering support here in what just opened 8:30 if we're going to get
Speaker A
this move back up I'd like to see at at 830 making an opposing run to form a new order block right there what do we see well we get we hit our TP after getting tagged in but we also form a new order
Speaker A
block so let's see what happens here right we wanted to take another trade or just let it go we'll just see how it works out you see how it's also lined up with 830 and midnight so we have quite a
Speaker A
few overlapping confluences and there we go right so that would be our propulsion Block it's an order block built off an order block but I hope you can see how we went through we realized it wasn't a London reversal because London is
Speaker A
continuing higher this important level we hit was forming the wick right on the daily chart you can see we didn't have a wick prior to that and we reach in to this previous range here so then we use
Speaker A
that to frame trades lower getting the New York reversal for a continuation lower let's go through a couple more examples so in this next example here we're going to be talking about framing a trade off of external liquidity and
Speaker A
then the continuation that follows you can see here we have a range and here is the Range High and then we can consider any of these for the range low but I will use the most current swing low here
Speaker A
so dropping down to the next day let's see what we can use with daily profile on this high so here we are with the 15minute chart so let's see what happens so here in London what happens well we
Speaker A
sweep out this low and form a low so likely to continue where continue higher to this high right so now you can see New York open makes an opposing run continues higher and now we're taking all the liquidity from that previous
Speaker A
day's high now what do we get an aggressive move out and then back into the range what is this a change in the state of delivery so if I wanted to play the reversal day here we have the buildup of
Speaker A
low resistance liquidity down here we have session lows so I could look to take an entry here my stop above the order block Target 2 R right in here and let's see if this works out you can see we didn't get tagged in
Speaker A
before it went and that is okay now since that is the reversal day let's go back out to the Daily now what do we notice out here on the daily chart you can see we had a range we swept out one
Speaker A
side of that range we have low resistance liquidity resting here as you can see we have previous days lows lined up and then this candle is a bearish reversal candle and where does it close inside previous day's high so with that
Speaker A
all put together I'm anticipating an open high low close so let's drop down to the 15minute chart to confirm this down here on the 15-minute chart I want to go through London and see what it did so looking at London did it form any
Speaker A
significant High to trade off of in New York no we actually swept London's High here so I'm anticipating what a New York reversal as I'm still bearish so as I come into the New York session what times am I looking at 8:30 9:30 10 right
Speaker A
so what happens at 8:30 8:30 you can see we get manipulation up and then we displace and close lower now there's a lower time frame entry in there trading view just doesn't let me go back lower on that time frame but we could also see
Speaker A
what happens with the 15minute chart here once they close below what do we see well we'd want to see previous day low taken as well as these lows here so let's see how that works out and there we go and if you notice
Speaker A
830 offers an entry 8:30 manipulation 9:30 continuation similar to London and New York what happens at 9:30 here well you can see with this Wick New York makes an opposing run up to sweep out some of these highs that's lower time
Speaker A
frame order block formation to then continue lower and we take out these lows so we form our open high low close and if we let this play out what happens we get more of a continuation lower and we come back inside the range to close
Speaker A
let's take a look at one more final example so here we are on the hourly chart for ES and what do we see well we see we have a reversal here we also had smt at these highs and we have low
Speaker A
resistance liquidity resting here and then we have an order block here right this swept out all these lows into the Gap displacement and close over now if you want to really refine this down what can you see well you can see from this
Speaker A
high here go ahead and Mark it out to this low there's a gap right what does that mean that means that there is a higher time frame imbalance right here so with that idea in mind let's drop into the charts and kind of combine two
Speaker A
different profiles so as we drop down to the 15-minute chart here let's see what London does you can see with London we take out this previous high now we have an up close candle here let's go ahead and
Speaker A
zoom in and so if we get a closure below here that is a change in the state of delivery for London to trade off of in New York now you might be saying why am I looking for this for a
Speaker A
New York reversal video well let's just take a look here so we are getting that continuation lower off of London's range right but what happens is we reach our time frame objective right so fixing our time here I had it on the wrong setting
Speaker A
you can see 8:30 was the manipulation up New York we get a manipulation down that's what the wick is Right a move down and then back up so this is actually a London reversal but then can also be framed as a New York reversal so
Speaker A
let's see right here New York makes the opposing run lower into the objective then we close over so this order block entry in here would be valid to Target where the highs right we have equal highs up here so looking at something
Speaker A
like this how does it work out there it goes right so this is just one example from the previous video that I wanted to expand on but you can see we hit the higher time frame objective and then
Speaker A
that is used to frame a New York reversal higher now I hope you found this video helpful if you did please consider liking and subscribing and I'll see you guys in the next one have a good one
Topics:ICTdaily profileNew York reversalLondon reversalchange in state of deliveryPD arrayliquidityorder blockkill zonesTradingView