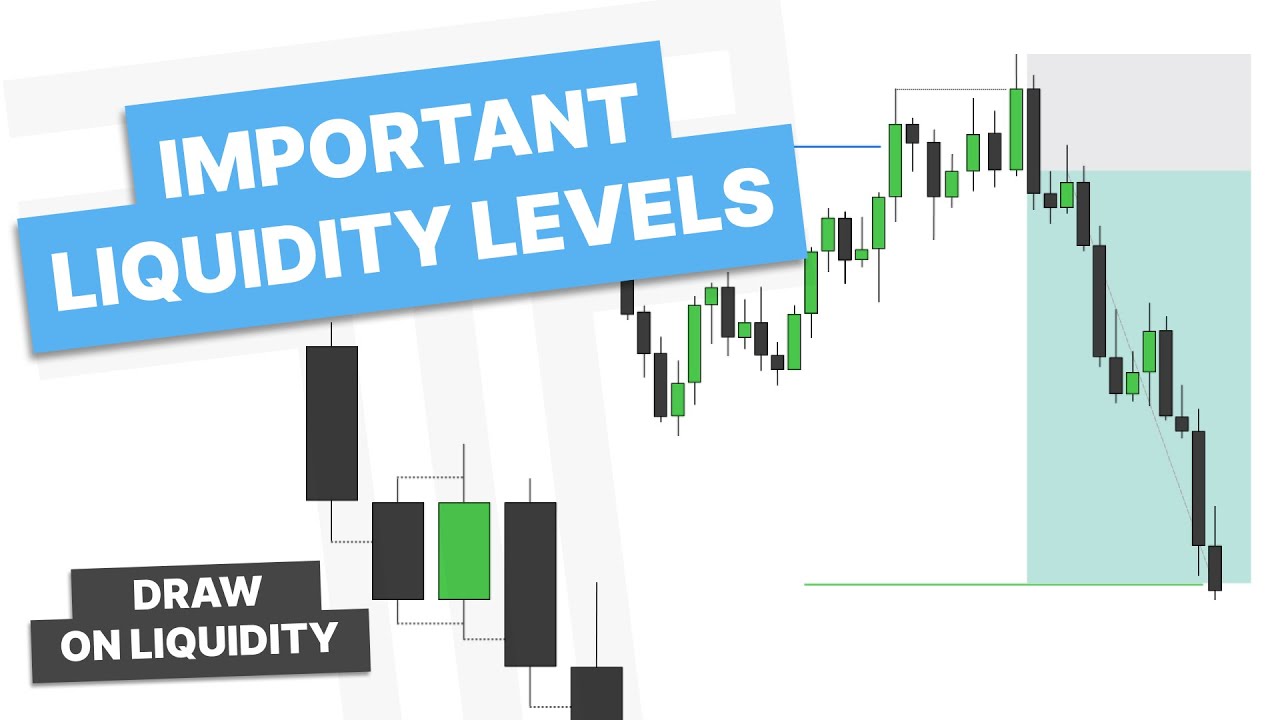
TTrades explains the ICT London reversal and New York continuation daily profile, showing how 2-5am London moves set the daily wick before NY continues the open-high-low-close.
Key Takeaways
- A London reversal (2-5am) often forms the daily candle wick and sets the directional bias for the day
- New York session typically continues in the direction of the London reversal, completing the daily OHLC
- Confirmation comes from a market structure shift and an order block or propulsion block retest
- Entries are taken in New York after a retracement into the London range, with stops beyond the low/high and targets around 2R or equilibrium
What the video covers
- Part one of a four-part series on ICT daily profiles, focusing on the London reversal pattern
- Defines the key sessions: London kill zone 2:00-5:00 and New York AM 8:30-12:00 (often extended to 12)
- A London reversal is a classic expansion candle: open, expand one direction to make a wick, then reverse and close
- Bullish example: price drops during London to form the daily wick, changes state of delivery or shifts market structure, then New York continues higher
- Bearish example: price spikes high during London, shifts market structure lower, and New York continues down
- Uses internal liquidity and equilibrium of the range as initial price targets
- Walks through daily oil chart and 5-minute/15-minute examples to identify order blocks and propulsion blocks
- Describes entry approach: wait for accumulation-manipulation-distribution in NY, enter on order block retest, stop at the low, target 2R
- Emphasizes waiting for an opposing move before New York to get on the side of the continuation
- Highlights watching important time levels such as 9:30 and 10:00 for reactions
Chapters
- 00:00Introduction and series overview
- 01:09Defining sessions and kill zones
- 02:09Bullish London reversal explained
- 03:36Bullish example on the daily oil chart
- 04:36New York accumulation, manipulation and distribution
- 06:23Bearish London reversal examples
- 08:00Waiting for opposing moves before New York
- 09:35Further examples and important time levels
Full Transcript — Download SRT & Markdown
Speaker A
[Music]
Speaker A
How's it going everyone? This video is going to be part one in a four-part series on daily profiles, so this video will cover London reversal. Let's hop into the PDF and get started.
Speaker A
we're going to focus on London from 2: to 5:00 and then New York a.m. so generally I'm looking at 8:30 to 12 I kind of extend this out to 12 personally now what is a London reversal well a
Speaker A
Now, the first thing that needs to be understood with daily profiles are the sessions and kill zones. So here on the screen, we have kill zones, so you can see Asia, London, here's our New York a.m., and then p.m. What we're going to do is separate it out, and we're going to focus on London from 2:00 to 5:00, and then New York a.m. Generally, I'm looking at 8:30 to 12. I kind of extend this out to 12 personally.
Speaker A
close so what does that look like on the lower time frames well with a bullish London reversal or a bullish classic expansion we'll have our open we will drop down during London or 2 to 5 this is creating the wick of the daily candle
Speaker A
Now, what is a London reversal? Well, a London reversal is basically a classic expansion candle. So we open the candle, we make a high, we expand lower to make a low, and then close. And then, for a bullish example, we open, manipulate lower to expand, and then make our high and close.
Speaker A
in a high during London or 2 to 5 change the state of delivery or get a market structure shift inversion however you define it this London reversal leads into a New York continuation completing the Open high low close of the daily
Speaker A
So what does that look like on the lower time frames? Well, with a bullish London reversal, or a bullish classic expansion, we'll have our open. We will drop down during London, or 2 to 5. This is creating the wick of the daily candle. We'll then change the state of delivery, or get a market structure shift, and then New York session will continue off of London's reversal. So London reverses, New York continuation.
Speaker A
continuation higher and we have internal liquidity right here so that will be our first Target however we can trade up to equilibrium of this range so we'll mark that out now dropping down to the 15-minute time frame so here we are in
Speaker A
Similarly, here with a bearish London reversal, we open, we put in a high during London, or 2 to 5, change the state of delivery, or get a market structure shift, inversion, however you define it. This London reversal leads into a New York continuation, completing the open, high, low, close of the daily candle.
Speaker A
London let's see what happens what do we notice about London between 2 to 5 or right around 2 to 5 we make a move lower right and then what do we do we reach into the previous range we have a down Clos candle and then we
Speaker A
Let's go into the charts and go over a few examples of this. So here we are on the daily oil chart. If you notice, we made a reversal right here, a bullish reversal candle, and then we're getting a continuation higher, and we have internal liquidity right here. So that will be our first target. However, we can trade up to equilibrium of this range, so we'll mark that out.
Speaker A
New York I'm going to go down to the 5 minute time frame and let's see what we notice so here we have 8:30 we're in a consolidation range okay we get manipulation so accumulation manipulation distribution so ideally when we get the close over the series of
Speaker A
Now dropping down to the 15-minute time frame. So here we are on the 15-minute chart. You can see our equilibrium of the range is marked out here, and that daily fair value gap is here. So zooming in, let's take a look at the daily profile. What I want to look for is, go into London. Now, if we're in London, let's see what happens. What do we notice about London between 2 to 5, or right around 2 to 5? We make a move lower, right, and then what do we do? We reach into the previous range. We have a down close candle, and then we close over this down close candle. So at 2 to 5 a.m., London reverses and changes the state of delivery.
Speaker A
we get tagged in you notice series of down Clos candles into an order block you now have a propulsion block right here here you can see how that gets retested and there we go we hit 2 R so
Speaker A
So what does that mean for New York? Well, ideally, if we are bullish, we're looking for a continuation higher during New York. So as we approach New York, I'm going to go down to the 5-minute time frame, and let's see what we notice. So here we have 8:30. We're in a consolidation range. Okay, we get manipulation, so accumulation, manipulation, distribution. Ideally, when we get the close over the series of down close candles here, that will form an order block. So now we have done that. Then I can look to take a position here. I stop on this low and look to target 2R. Let's see how this works out.
Speaker A
London makes the wick of this daily candle and then we get a continuation through New York and that is completing the open low High close of the daily candle so let's let this play out you can see we go quite a bit higher
Speaker A
So here we get tagged in. You notice a series of down close candles into an order block. You now have a propulsion block right here. Here you can see how that gets retested, and there we go, we hit 2R.
Speaker A
play out towards midnight and then into London session what do we notice this here we are in London and what do we see well we see London sweeps this High here now since this is a little bit messy I will go up one time frame to the
Speaker A
So zooming back out to the 15-minute chart, let's take a look at this. You can see between 2 to 5, or London, London makes the reversal, New York continues. So if we pull up the daily candle, you can see London makes the wick of this daily candle, and then we get a continuation through New York, and that is completing the open, low, high, close of the daily candle. So let's let this play out. You can see we go quite a bit higher, but that is catching the New York continuation from London reversal.
Speaker A
approach New York session I'd want to see some sort of opposing run or move higher to get on side with a continuation lower so letting this play out what do we notice we get a move higher into these opposing candles or an
Speaker A
Let's hop into another example. So here we are on the 15-minute chart, and if you notice, if we're bearish, we want to see what an open, high, low, close. So as we let this play out towards midnight, and then into London session, what do we notice? Here we are in London, and what do we see? Well, we see London sweeps this high here. Now, since this is a little bit messy, I will go up one time frame to the 30-minute chart. If you notice, we have a pretty clear series of up close candles here to use for our change in the state of delivery. So here we get the change in the state of delivery.
Speaker A
we hold that and continue lower you can see London forms a reversal New York continues off of that reversal London reversal New York continuation let's hop into another example so here we are in our next example and so let's get to London
Speaker A
Now, as I approach New York session, I'd want to see some sort of opposing run or move higher to get on side with a continuation lower. So letting this play out, what do we notice? We get a move higher into these opposing candles, or an order block. So I could look to get on side in here for this New York continuation lower. Or what do we have here? Another 30-minute propulsion block. In this case, let's see if that gets retested at 10:30, 8:30, little volume imbalance. We hold that and continue lower. You can see London forms a reversal, New York continues off of that reversal. London reversal, New York continuation.
Speaker A
that high so where would our change in the state of delivery be right there so let's see what happens here we get a change in the state of delivery if I was trading London I could look to get ons side with
Speaker A
Let's hop into another example. So here we are in our next example, and let's get to London session. You can see we kind of just consolidate, but where do we reach in London, or right at the end of London? Well, we reach for this high here. Now we have a series of up close candles into that high, so where would our change in the state of delivery be? Right there. So let's see what happens here. We get a change in the state of delivery. If I was trading London, I could look to get on side with a short position here. However, I focus on New York session. Now, as we come into New York, what are the important time levels that we are looking for? 8:30, 9:30. So 8:30 opens and we make an opposing run, right? Since we are looking for a continuation lower, and 8:30 moves higher, I see that as a manipulation move to continue lower.
Speaker A
since we are looking for a continuation lower and 8:30 moves higher I see that as a manipulation move to continue lower so what do we have right here well if we close below this now we have an order
Speaker A
So what do we have right here? Well, if we close below this, now we have an order block. We do close below it, so if I want to get on side, I will enter a position there, my stop on this opposing run, and then I'll look to target 2R. And there we go, we get 2R, and we go ahead and make a low right around 10, or another important time level. So you can see London reversal, New York continuation.
Speaker A
ahead and make a low right around 10 or another important time level so you can see London reversal New York continuation let's get into another example so here we are with another example let's see what happens during London well you can see we had some low
Speaker A
Let's get into another example. So here we are with another example. Let's see what happens during London. Well, you can see we had some low resistance liquidity in London, made a move higher, running that out. Here is our series of up close candles, and there we get a close below it. So if I was trading London, I could look to get on here. However, I trade New York, so what happens as I enter into New York? Well, here we have 8:30. If I'm looking for a continuation lower, I'd ideally like to see it manipulate up, but it manipulates down, which gives me a reason to think we get a retracement here. We get a retracement back up into this previous range here, so I could look to get on side in here for a short to go lower, and there we go, right at 10:00 a.m., or another important level. Due to the 4-hour open, high, low, close, we get a continuation lower.
Speaker A
happens as I enter into New York well here we have 830 830 if I'm looking for a continuation lower I'd ideally like to see it manipulate up but it manipulates down which gives me a reason to think we
Speaker A
So once again, London reversal, New York retraces into London's range and continuation lower, creating the open, high, low, close of the daily candle. Let's see how this plays out. You can see open, high, low, and then we close in here for the daily candle.
Speaker A
level due to the 4-Hour open high low close we get a continuation lower so once again London reversal New York retraces into London's range and continuation lower creating the Open high low close of the daily candle and let's see how this plays out you can see
Speaker A
Let's go to another example. So here we are on ES, the 15-minute chart. Let's see what London does. You can see London, we have this range here. What does London do? It goes and sweeps out this side of the range. Now, if I'm looking at this series of up close candles that swept that high, the change in the state of delivery would be right here, or the single in this case. That is our change in the state of delivery. Then I'd be looking to this low if I want to get on side for London. Or let's see what happens. We have 8:30 news, which manipulates up into London's order block here, and then continues lower. Now, using our important time levels that I talked about in a previous video, what times would I be watching here? Well, 9:30 and 10, right? So
Speaker A
and it sweeps out this side of the range now if I'm looking this series of up Clos candles that swept that high would be right here or the single in this case that is our change in the state of
Speaker A
delivery so then I'd be looking to this low if I want to get on side for London or let's see what happens we have 8:30 news which manipulates up into London's order block here and then continues lower Now using
Speaker A
our important time levels that I talked about in a previous video what times would I be watching here well 9:30 and 10 right so as we come into 9:30 here we get what a move lower into an important
Speaker A
level and then I'll leave this for the next video for our last and final example what do we see right here well we see a sweep below previous day low a close back inside and what is this this
Speaker A
is a bullish reversal candle I'd be looking for the next day to do what to trade higher and with that idea in mind I'll drop down to the 30-minute chart here so getting into the next day let's see what happens as we approach London
Speaker A
so you can see London here from 2 to 5 what happens we have a move lower and then we close over the series of down Clos candles here that would be an order block but as we move into New York what
Speaker A
happens we come back and retest test this level here and then trade to this High we can't displace over this High we come back into the range now if this is going to continue higher what do I want
Speaker A
to see well I want to see the mean threshold of this being respected which it is along with midnight open being used as a support level I'd still like to see this trade higher we get into the next day what happens once again London
Speaker A
forms a low here and we trade higher which would finish off the TP for any position I entered here I hope you guys enjoyed this video in learning about the first of four daily profiles that I focus on if you do want to learn about
Speaker A
the next ones make sure you turn on the notifications so you do not miss those videos hope you have a great rest of your day I'll see you guys next time have a good one
Topics:ICTdaily profileLondon reversalNew York continuationkill zonesmarket structure shiftorder blockpropulsion blockliquiditypower of three
![Intro To TTrades Fractal Model [Indicator & Settings] — Transcript](https://i.ytimg.com/vi/CqMIh-Vvhbg/maxresdefault.jpg)


![Change In State Of Delivery [CISD] – Orderblock Formation – ICT Concepts — Transcript](https://i.ytimg.com/vi/CHIK5oBRKiw/maxresdefault.jpg)