Skip to content
Get App

I Tested 152 Exit Strategies on 17,768 Stocks

Backtest of 152 stock exit rules vs random timing on 17,768 US stocks (2018-2026). Most famous sell signals do no better than random; only sell-into-strength exits show a modest edge.

Key Takeaways

  • Classic technical sell signals such as the death cross and 200-day average exits do no better than selling on a random day.
  • Exit rules that sell into strength (overbought readings, upper Bollinger band) showed a modest, possibly real edge versus random timing.
  • Exit rules that sell into weakness (breakdowns, moving average breaks) generally underperform random timing except during crashes.
  • Apparent edges often come from flawed benchmarks; placebo tests are essential before trusting backtest results.

What the video covers

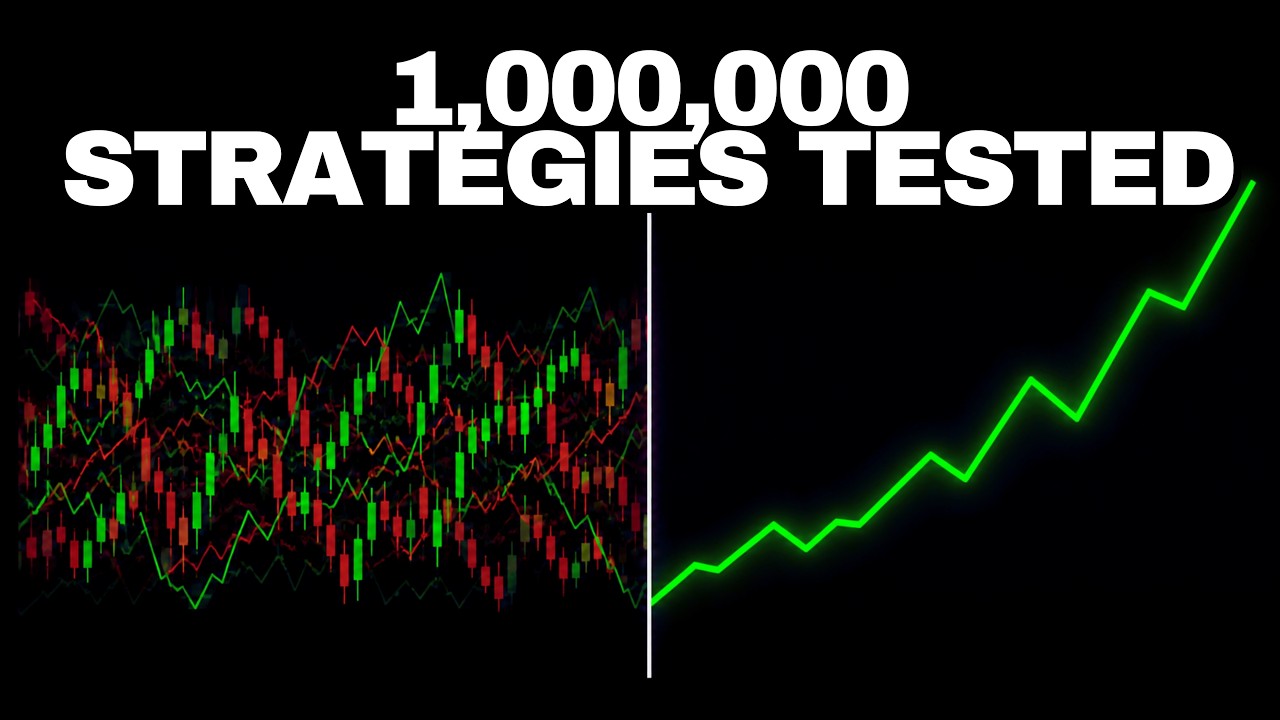
  • The creator tested 152 exit rules on 17,768 US stocks from 2018 to 2026, holding entries constant at 100,000 random buys and varying only the sell rule.
  • Initial benchmark (shuffled holding times) was flawed; a placebo test using random sell signals showed a 'beat random' result, exposing the bias and prompting a corrected method that moves each indicator's own sell signals to random dates on the same stock.
  • With the corrected benchmark, 81 of 152 exit rules (53%) beat random timing, but none remained statistically significant after correcting for testing 152 rules at once.
  • Famous exits underperform: selling below the 200-day average is 0.2% worse than random, the death cross 0.8% worse, and MACD crossovers roughly random.
  • Exits split into two camps: 'sell into strength' (RSI, stochastic, Bollinger band exits) averaged 0.38% better than random per trade, while 'sell into weakness' (moving average breaks, breakdown exits) averaged 0.34% worse.
  • Breakdown exits paid off mainly in the 2020 COVID crash, functioning as crash insurance that costs a premium in ordinary years.
  • The creator notes the strength/weakness grouping was made after seeing results and needs out-of-sample validation.
  • Limitations: daily US stock data only, no futures, intraday, or crypto; stop-losses were tested in an earlier video where no stop-loss performed best.
  • The video ends with a promotional pitch for the creator's paid community and a jab at a commenter's criticism.

Answers

Questions about this video

Did the death cross beat random selling in this test?

No. The death cross underperformed random timing by about 0.8% per trade, making it one of the weaker exit signals tested. The creator describes it as losing to a random date.

Which type of exit showed the most promise?

Exits that sell into strength, such as RSI coming down from overbought, stochastic above 80, or closing above the upper Bollinger band. These averaged about 0.38% better than random per trade and were positive in seven of nine years.

Why did the creator change the benchmark method?

The original method shuffled holding times across trades, which biased results because it paired long holds with stocks that were delisted and short holds with stocks that kept running. A placebo test with random sell signals showing an edge revealed the flaw, so the creator switched to moving each indicator's sell signals to random dates on the same stock.

Full Transcript — Download SRT & Markdown

00:00
Speaker A
The death cross is the most famous sell signal in trading. I tested it on 17,768 US stocks and selling on a completely random day did better. Then I tested 151 more exit rules and only one type of exit kept beating chance almost every
00:20
Speaker A
single year. All of this started with a comment. Recently, I made a video where I ran every trading indicator over those same stocks. That video got quite the headwind in the comments. For instance, from portfolio boss who wrote this. Now
00:36
Speaker A
do the opposite. Random entry with defined exit rule. Now you'll see results better than random because a sell rule always has a buy rule. Buy if not on a sell signal. Now you have a system that isn't simply defined by an
00:52
Speaker A
arbitrary two week sell signal, which clearly doesn't work. written with the calm certainty of someone who has never been asked by their spouse where the money went, but it's a good comment. In that video, I held every trade for
01:06
Speaker A
exactly 2 weeks, and nobody trades like that. If your rule says sell below the 200 day average, it also tells you to stay in on every other day. So, the exit is the strategy, and I never tested it.
01:20
Speaker A
Every trader knows when to buy. Almost nobody knows when to sell. Sell below the 200 day average. Sell on the death cross. Sell when MCD rolls over. Sell when RSI is overbought. Each of those comes with a mentor. And the mentors all
01:37
Speaker A
have a flawless exit strategy. They sell the course at the top, the Discord on the way down, and when the refund requests start, their story to a podcast about overcoming adversity. So, I tested all of them. The setup, same stocks,
01:53
Speaker A
2018 to 2026. I picked 100,000 random days on random stocks and bought at the next morning's open. No indicator, no chart, just a random number generator with a brokerage account, which is also how a lot of fund managers work. They just charge 2% for
02:12
Speaker A
it and spend it on cocaine and a second family in Miami. Then I held each trade until a sell rule fired and sold at the next open or after one year if it never fired. Every one of the 152 rules got
02:25
Speaker A
the exact same 100,000 entries. So the only difference between them is when they sell. And a sell rule has to beat selling at a random time. This is where I almost had to film an apology video.
02:39
Speaker A
My first version shuffled the holding times between trades and sold at those random times. 108 of the 152 exit rules beat it and nine passed every significance test I have, including 2023 to 2026. A quant lapper would have
02:57
Speaker A
posted that by lunchtime. But before I believe anything, I build a rule that knows nothing. Sell signals on random days. Those have to land at zero. They didn't. The rarer ones beat random by up to 0.8% as confidently as the real indicators.
03:15
Speaker A
My dice were beating my dice. So, the benchmark was broken. The reason shuffling holding times hands a one-year hold to a stock that gets delisted after 3 months and a 3-month hold to a stock that keeps running. That mismatch alone
03:32
Speaker A
was worth more than most indicators. If I'd published it, I'd now be selling a $997 exit masterass with testimonials from my cousin under five different names. So, I rebuilt it. For every indicator, I took its own sell signals on each stock and
03:50
Speaker A
moved them to random dates on that same stock. Same stock, same number of cells, same spacing, and only the timing is gone. The no nothing rules now land at zero. and a cheating rule that knows the stock drops more than 3% tomorrow, beats
04:06
Speaker A
random by 4.5% per trade. So, the test finds an edge when there is one, and stops inventing one when there isn't.
04:14
Speaker A
Here's what came out. 81 of the 152 exit rules beat their own random timing.
04:21
Speaker A
That's 53%. A coin flip that went to business school. The typical difference was 0.03% per trade. $3 on a $10,000 trade. And after correcting for testing 152 rules at once, not one was significant. The famous ones, selling below the 200day
04:44
Speaker A
average, 0.2% worse than random timing. The death cross, 0.8% worse. The most dramatic name in technical analysis loses to a random date. MCD crossing below its signal line zero down to the second decimal. Super trend 0.3% better well inside the noise. So buy if not on
05:08
Speaker A
a sell signal with the classic trend exits does about as well as random. Your cat would get the same result and your cat doesn't charge $199 a month for a signals discord. But when I sorted the exits by type, they split into two
05:23
Speaker A
camps. Camp 1 sells into strength. RSI coming down from overbought. Stochcastic above 80, the price closing above the upper Ballinger band. All six Ballinger exits beat random. All six stochcastic exits beat random. 14 of the 15 RSI exits beat
05:42
Speaker A
random. Camp 2 sells into weakness. The price falling below a moving average. Moving average crossovers breaks below a 20-day or 52- week low. Of the 30 moving average crossovers, four beat random.
05:58
Speaker A
Donkey and breakdowns 0 out of five. Kelner 0 out of three. That's the kind of hit rate you normally only see in a prop firm's payout statistics. Then I pulled them. I grouped these after seeing the results. So, it's a strong
06:14
Speaker A
pattern that still needs fresh data. If you do that and don't mention it, you're a quant researcher on LinkedIn. Selling into strength 36 rules. 0.38% better than random timing per trade with a typical hold of about 5 weeks.
06:32
Speaker A
Positive from 2018 to 2022. Positive again from 2023 to 2026. Positive in seven of nine years. Selling into weakness. 53 rules. 0.34% worse than random, negative in seven of 9 years. The one year selling into weakness clearly paid off was 2020, the
06:56
Speaker A
COVID crash. When a drop keeps going, a breakdown exit gets you out. In a normal year, it sells you at the bottom of an ordinary dip, the day before it bounces.
07:07
Speaker A
So, a breakdown exit is crash insurance, and you pay the premium every year without a crash. It's a prenup. great in the one year you need it and every other year it just makes dinner awkward.
07:19
Speaker A
Researchers have known why since the early 1990s. Individual stocks tend to give back part of their move over the next few weeks. A stock that just ran up tends to cool off and one that just dropped tends to bounce. Selling after a
07:35
Speaker A
runup rides that and selling after a drop fights it. So when should you sell?
07:42
Speaker A
The death cross and the chart breakdown are among the worst ways and a random date would have done slightly better. If you exit on an indicator, sell into strength when the stock is stretched and the comments are full of rocket emojis.
07:56
Speaker A
That's also exactly when the gurus launch their course. So, for once, they're following their own strategy.
08:02
Speaker A
And keep it in proportion. The whole edge is about $38 on a $10,000 trade.
08:09
Speaker A
The exit really is the strategy, but random entries with a textbook exit don't beat random. And with the classic trend exits, they do slightly worse. The limits daily data on US stocks. No futures, no intraday, no crypto. I
08:26
Speaker A
didn't combine exits with indicator entries, and I didn't test percentage stop- losses here. I did that in an older video. And the best stop-loss was no stop-loss. And the strength versus weakness split needs new data before anyone bets their kids' college fund on
08:43
Speaker A
it. If you want to test your own exit, I've built it for the Algo Vibes community. Support my work and get access to all code and infrastructure and more than 50 hours of educational video material, including this entire
08:57
Speaker A
analysis, the exit lab with all 152 cell rules on any stock, the random timing benchmark, and the placebo test that caught my own mistake before it went live. The link is in the description.
09:11
Speaker A
And portfolio boss, thanks for the comment. Halfright is a better hit rate than most of the indicators in this video. Thanks for watching and I see you in the next one.
Topics:exit strategybacktestingtechnical analysisdeath crosssell signalsrandom benchmarkRSIBollinger Bandsalgorithmic tradingstock market

Get More with the SozAI App

Transcribe recordings, audio files, and YouTube videos — with AI summaries and speaker detection. 30 minutes free.

Or transcribe another YouTube video here →