Algovibes tests a 2024 academic day trading strategy on S&P 500 and NASDAQ futures: it fails on the S&P but survives 2020-2026 on the NASDAQ, with a small, volatile edge.
Key Takeaways
- Academic intraday strategies often fail out of sample, but this volatility-band breakout strategy held up on the NASDAQ from 2020 to 2026 while failing on the S&P 500.
- The edge is small and concentrated: a low win rate and a few large trending days generate most of the profit.
- Robustness tests on parameters, costs, and signal direction support the result, but dependence on a few big days is a significant risk.
- Drawdowns can last over a year, so the strategy requires substantial patience and capital tolerance.
What the video covers
- A 2024 paper by three researchers (one a University of St. Gallen finance professor) proposed a volatility-band intraday breakout strategy claiming ~1,985% returns on the S&P 500 from 2007-2024.
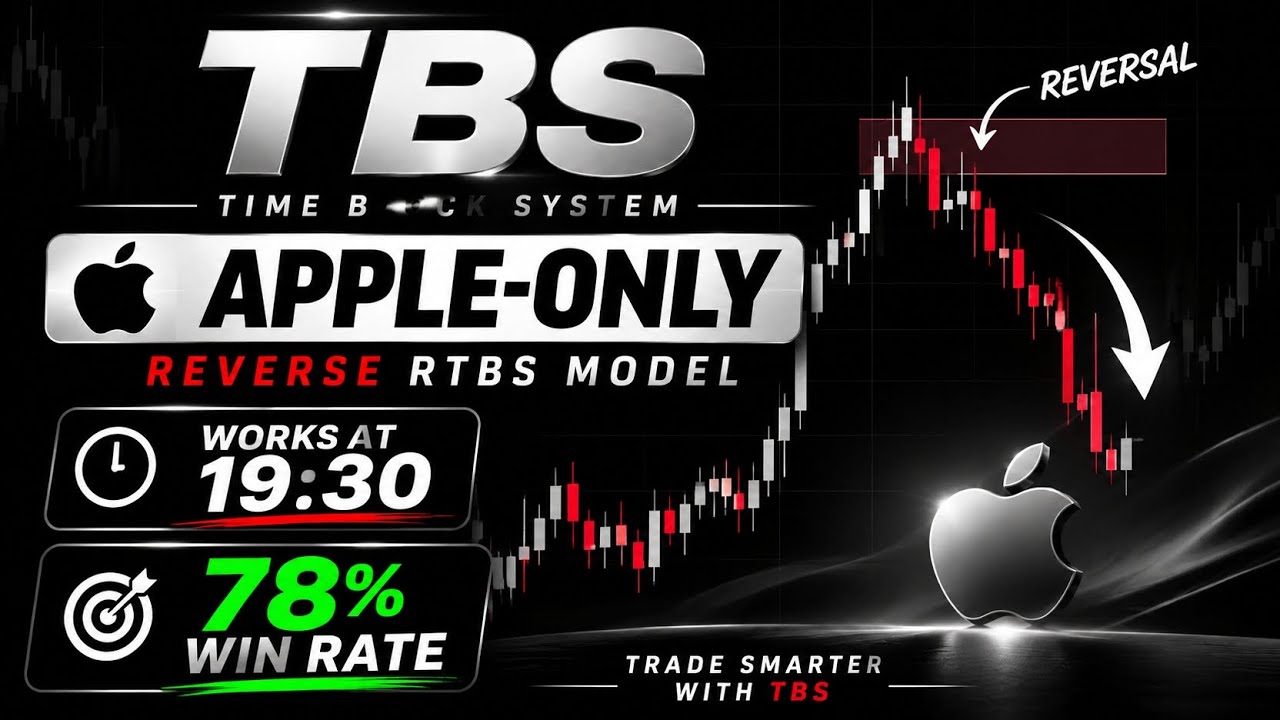
- The strategy builds a band from the average intraday move over the last 14 days; a breakout above or below the band triggers a long or short, with exits on band re-entry or VWAP crossing, and always flat at the close.
- The author ran the exact rules on S&P 500 futures from 2020 to October 2026 and found it essentially dead: about 0.5 points per trade with a t-statistic near 1.
- On NASDAQ futures the same rules produced about 6.8 points per trade after costs with a t-statistic of 2.6, and every year from 2020 to 2026 was positive.
- The win rate is only 41%, with average winners of 84 points and average losers of 46 points, so profits depend on occasional large trending days.
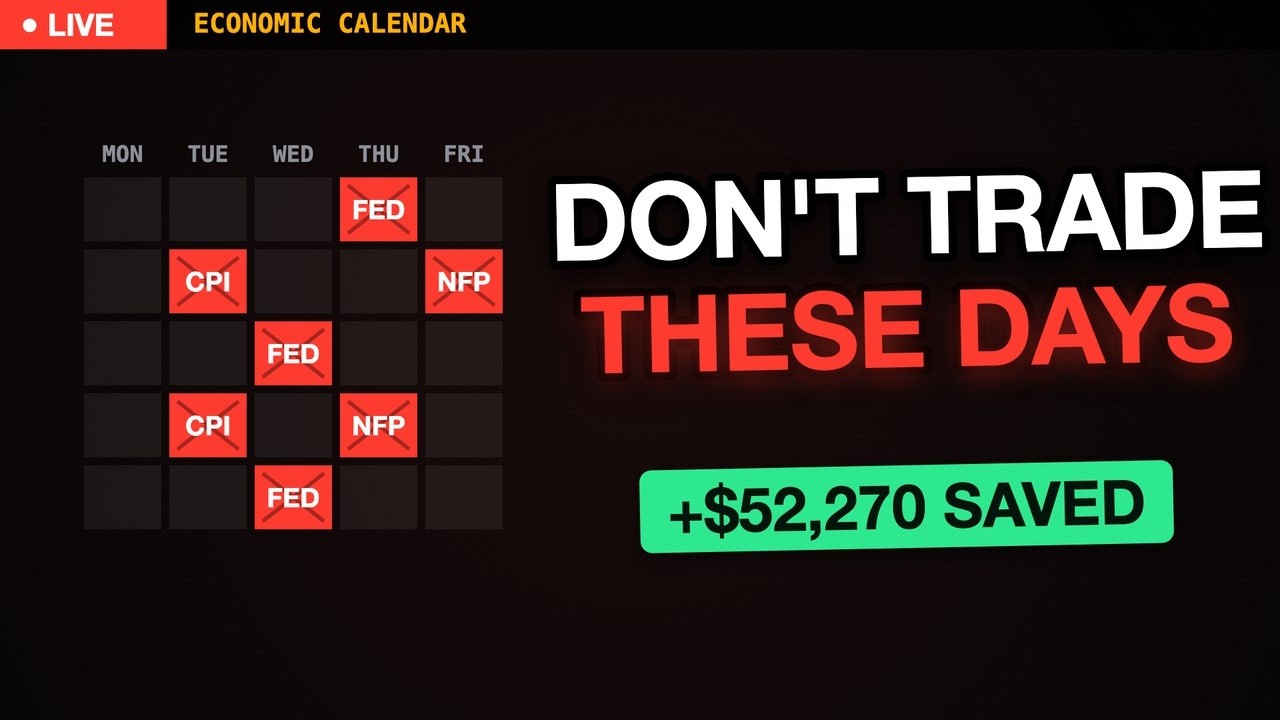
- Most profit comes from the 20% of days with the largest moves; the April 9, 2025 tariff pause alone produced about $3,800 on one micro contract.
- Robustness checks: flipping signals randomly, varying lookback and check frequency, adding four ticks of slippage, and an independent rebuild all kept the edge mostly intact.
- Fragility: removing the 10 best days cuts total profit from about $19,000 to about $7,300, and the worst drawdown lasted roughly a year and a half.
- The strategy failed on the Dow and Russell 2000, suggesting the NASDAQ's trending behavior, driven by a few large tech stocks, is the source of the edge.
- Practical takeaway: a real but small edge that requires patience and a large drawdown tolerance, and which may not fit prop firm drawdown limits.
Chapters
- 00:00Introduction: An Academic Day Trading Paper
- 00:46Setting Up the Test
- 01:33How the Volatility Band Strategy Works
- 02:14Trading Rules Explained
- 03:00Results on the S&P 500 vs NASDAQ
- 04:30Year-by-Year Performance and Trade Statistics
- 05:24Stress-Testing: Randomization, Parameters, Costs
- 07:08Dependence on Big Days and Drawdowns
- 09:06Conclusion and Final Verdict
Full Transcript — Download SRT & Markdown
Speaker A
In 2024, three researchers published a day trading strategy. And one of them is an actual finance professor at the University of St. Gallen. So for once, the strategy comes with footnotes and not with a Dubai address and a Telegram
Speaker A
group. They tested it on the S&P 500 from 2007 to 2024. And they got plus 1,985% after costs. That's almost 20% a year with a sharp ratio of 1.33.
Speaker A
And they called the paper beat the market. I mean, come on. Academics are usually not allowed to have that much fun with a title. Now, you know me. I've tested a ton of day trading strategies on this channel, and almost all of them
Speaker A
make about zero before costs and then lose money after costs. So, I was pretty sure I'd kill this one in 10 minutes. I took the exact rules from the paper and ran them on futures minute data from 2020 to October 2026.
Speaker A
On the S&P 500, the market they used in the paper, it's pretty much dead. But on the NASDAQ, I couldn't break it. And believe me, I tried. Okay, so how does it work? The basic idea is that most of
Speaker A
what the market does during the day is just noise. At 10:00, the NASDAQ is usually somewhere close to where it opened. A bit up, a bit down. Nobody cares. So, the strategy looks at the last 14 days and asks, "How far does the
Speaker A
NASDAQ normally move by this time of day?" By 10:00, that's about a third of a percent. By noon, it's around 0.6%.
Speaker A
And that gives you a band around the opening price. As long as the price is inside that band, it's noise and you don't touch anything. If it breaks out of the band, something's actually going on and you jump on it. The rules in
Speaker A
detail. Every 30 minutes, starting at 10, you check the price. If it's above the upper band, you buy. If it's below the lower band, you go short. If there was a gap overnight, the band starts at yesterday's close on that side. So, a
Speaker A
gap by itself doesn't trigger a trade. You get out when the price falls back into the band or when it crosses the VWAP, which is the volume weighted average price of the day. And at the close, you're always flat. No overnight
Speaker A
positions. So, you actually get to sleep at night, which is more than most day traders can say, mostly because their wife is sleeping with the guy who sold them the course. I trade one contract, I pay commission, and I lose one tick of
Speaker A
slippage on every entry and on every exit. Let's start with the S&P 500 because that's the market from the paper. From 2020 to 2026, it makes half a point per trade. The T statistic is about one, so that could easily just be
Speaker A
luck. And 2026 is clearly in the red. So on its own market after their test period it pretty much stopped working.
Speaker A
And now the NASDAQ 1,564 trades and on average plus 6.8 points per trade after costs. The T statistic is 2.6. So it's unlikely that this is just luck. And every single year from 2020 to 2026 is positive. With one micro
Speaker A
NASDAQ contract, that's plus $19,354. Let's go through the years with one micro contract. 2020 plus $977.
Speaker A
2021 plus $1,478. Then 2022, the year everybody got wrecked, plus $4,10. 2023, plus 3,782.
Speaker A
2024 plus 3,267 2025 plus 426. But careful 3,779 of that came from April alone, the tariff crash. The other 11 months of 2025 together made about $250.
Speaker A
So yeah, 2025 was basically one month and then a lot of pain. and 2026 up to the end of September plus $1,813.
Speaker A
January was rough - $1,98. But then it came back and August and September were both clearly positive again. So, does it still work? So far, yes, just not every month and definitely not in a straight line. But the way it
Speaker A
makes that money is kind of weird. It only wins 41% of its trades. The average winner makes 84 points. The average loser costs you 46. Out of 1,667 days, it lost money on 550, made money on 443, and on the rest, it didn't trade
Speaker A
at all. So on most days, the NASDAQ goes nowhere. The strategy buys a breakout, the breakout dies, and you lose a little. If you take the 80% of days where the NASDAQ moved the least, the strategy lost $37,000
Speaker A
on those days. And then on the 20% of days with the biggest moves, it made $56,000.
Speaker A
So basically, you're paying a little bit almost every day just to be in the trade on the day when something crazy happens.
Speaker A
And the best day was April 9th, 2025. The NASDAQ went sideways all morning. The strategy got stopped out twice and then the tariff pause came out and the NASDAQ went up more than 10% in one afternoon. The strategy was long from
Speaker A
12:30 to the close and made $3,18 on one micro contract. One post from Washington and my back test made more that afternoon than most day traders made in all of 2025, which to be fair isn't hard because most
Speaker A
day traders lose money anyway. Okay, so now let's try to break it. First objection, it's just the NASDAQ going up. The NASDAQ went up a lot since 2020, so maybe anything that buys looks good. But the strategy's daily profit
Speaker A
has basically zero correlation with how the NASDAQ did that day. On the days the NASDAQ fell, it still made $8,536.
Speaker A
The shorts are weaker than the longs, sure, but they make money, too. Second, maybe the timing is good and the direction is just luck. So, I kept every single trade exactly the same. Same entry, same exit, and just flipped a
Speaker A
coin for long or short. And I did that a,000 times. Four out of a thousand reach the real result. And if you do the exact opposite of every signal, you lose 7.4 points per trade. Third, maybe they just got lucky with the settings. So, I
Speaker A
changed the look back. anywhere from 7 to 30 days and checked every 30 or every 60 minutes. Every combination makes somewhere between six and nine points per trade. If you check every 15 minutes, it gets worse around three
Speaker A
points because you keep jumping into noise, but nothing goes negative. Fourth, costs. I put four ticks of slippage on every entry and every exit, which is a lot on the NASDAQ, and it still makes 5.3 points per trade. Fifth,
Speaker A
my back test is wrong. Happens. You guys have caught me before. So, I gave only the written rules to an independent rebuild with its own code. It got 1,589 trades, plus 7.1 points per trade, and every year positive. So, this time it's
Speaker A
not me. And sixth, and this is the one that actually hurts, it depends on a few big days. If you take out the 10 best days out of almost $1,700, the $19,000 drop to about $7,300.
Speaker A
Still positive, but come the [ __ ] on. 10 days. Most of the money comes from a handful of afternoons. So, if you skip one of those days because you're tired, hung over, or sitting in a custody hearing, you might miss half a year of
Speaker A
profit. Does it work on other markets? On the Dow, it loses money. On the Russell 2000, it loses money, too. And that one's even statistically significant. So, it really only works on the NASDAQ. My guess is that the NASDAQ
Speaker A
just trends more during the day because a few giant tech stocks drive the whole index and when they move, everything moves with them. Since the paper came out in May 2024, it made 8.4 points per trade on the NASDAQ. That's good, but
Speaker A
it's only 549 trades, and that's just too short to prove anything by itself. So, what does it actually make? with one micro contract about $2,900 a year. The worst draw down was $3,61.
Speaker A
It started in April 2025 and it took until September 2026 to make a new high.
Speaker A
That's a year and a half of trading every single day and having nothing to show for it. And most prop firm accounts have a draw down limit of around $2,000.
Speaker A
So, if you started this on a proper account in 2025, you got shut down, even though the strategy itself was still fine. So, yeah, it's a real edge, but it's small. It only works on the NASDAQ, and you need a lot of patience for it.
Speaker A
Most days, you lose a little, and then every now and then, the market goes completely nuts and pays for everything.
Speaker A
Honestly, that's also how I'd describe my marriage. If you want to test this yourself, support my work and get access to all code and infrastructure and more than 50 hours of educational video material, this analysis included. The link is in the description. Thanks for
Speaker A
watching and I see you in the next one.
Topics:day tradingalgorithmic tradingNASDAQ futuresS&P 500backtestintraday breakoutVWAPquantitative financestrategy validationmicro contracts