5 Edges that refuse to die. — Transcript

Explore five proven structural trading edges backed by institutional research for stocks, options, and crypto to diversify and improve trading strategies.

Key Takeaways

  • Structural edges are based on institutional market mechanics and persist over long periods.
  • Diversifying across multiple trading models reduces risk and smooths equity performance.
  • Earnings surprise drift and initial volume breakout are two of the most robust and tested market anomalies.
  • Research, validation, and continuous learning are essential to maintain an edge and avoid alpha decay.
  • Professional traders focus on data-driven strategies rather than blindly following gurus or single models.

Summary

  • The video presents five structural trading edges supported by academic and institutional research, focusing on predictable market behaviors rather than vague concepts.
  • The edges include two long-term stock market models, one intraday equity model, one options model, and one cryptocurrency smart DCA strategy.
  • Emphasizes the importance of diversification across multiple trading models to adapt to changing market regimes and avoid reliance on a single strategy.
  • Discusses the earnings surprise drift, a well-documented anomaly where stocks continue to drift in the direction of earnings surprises for up to 60 days.
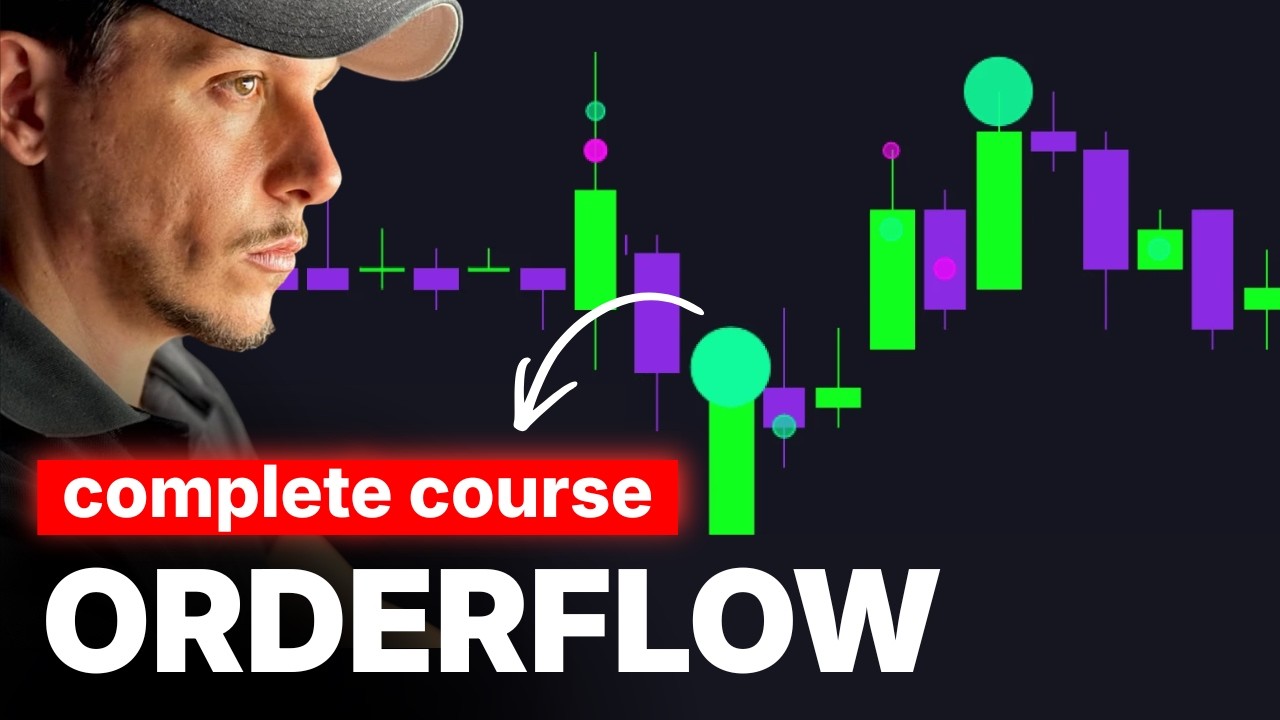
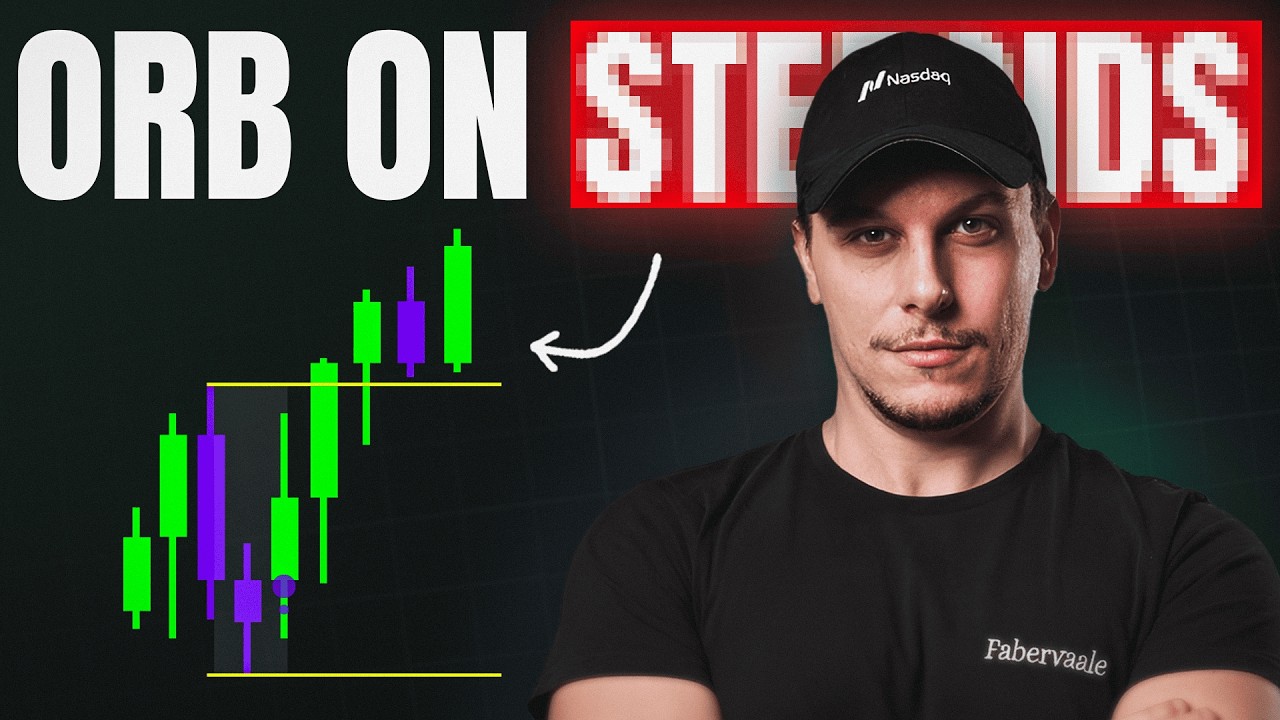
  • Explains the initial volume breakout (IVB) or initial balance drift, highlighting the predictive power of the first 30 minutes of trading in equities.
  • Stresses the need for research and validation of trading strategies to avoid alpha decay and blindly following gurus or untested methods.
  • Mentions the use of algorithmic execution like VWAP to explain why earnings surprise drift persists due to institutional trading constraints.
  • Provides references to academic papers and institutional studies validating these edges, including recent machine learning research.
  • Highlights the structural nature of these edges due to market mechanics and institutional behavior, making them persistent over time.
  • Encourages traders to test these models themselves and focus on risk-adjusted returns, alpha, and beta like professional hedge funds.

Full Transcript — Download SRT & Markdown

00:00
Speaker A
In this video, I will show you five of the best edges and trading models that you can use as a trader. And I'm not talking about some vague concepts or geometric shapes that I cherry-picked from other charts. I'm talking about
00:16
Speaker A
five repetitive and predictable behaviors that are vastly documented by institutional-level academic research. And they have persistently occurred in financial markets over the last decade.
00:32
Speaker A
Five of the so-called structural edges. We are not talking about a short-term inefficiency, but five behaviors that are structural because of how the plumbing of financial markets works. And that you, as a trader, could potentially extract
00:54
Speaker A
real alpha. Of course, this is not financial advice. It's only for educational purposes. Now, I have been involved in financial markets for multiple years. Some know me as a professional scalper, as I won multiple podiums in the most famous competition,
01:11
Speaker A
the Robbins Cup, or in the CME Equity Cup, or because, unlike many gurus, I traded live countless times. And I have literally tried every trading strategy you can name. And I have selected for you both what allowed me to build a
01:28
Speaker A
considerable amount of my wealth, but also the results of years and years and money invested in extensive quantitative research and learning constantly approaches and strategies from hedge fund managers, bank floor traders, and other professionals. Here's the five models
01:48
Speaker A
that I will show you. Two long-term models on the stock market, one intraday model on the equities market, one option model, and one cryptocurrency smart DCA. And you are probably asking yourself,
02:05
Speaker A
why do I need five approaches? Shouldn't I choose only one? Because the truth is, unlike retail traders that typically only trust one strategy, one model, and one guru, and basically choose a side like at the stadium, professionals in finance don't choose sides. They just follow the money. And
02:23
Speaker A
there are many ways to follow the money. If one stops working tomorrow, what would you do? You may panic, strategy hope, revenge trading. If instead you use many and diversified models, you will be more independent in changes
02:40
Speaker A
in market regime, and you will get a way smoother equity line. And you will see the more you scale in the trading profession, the more you will realize how important it is. Just like we are planning in the hedge fund that we are
02:55
Speaker A
in the process of building, to think in terms of alpha, beta, and risk-adjusted return. So, without further ado, let's meet these five models. Let's dive deep into my top five favorite structural edges. Here we will not talk about gurus, no hope trading, no mentor,
03:13
Speaker A
just data, okay? And this is my message to the trading industry, okay? Instead of trying to replicate the performance of your favorite guru, or trust blindly, okay, the strategies that you use, the work that you should do is called a
03:32
Speaker A
research and validation process. And this applies to everything. If you are an investor, if you are an intraday trader, if you want to trade stocks, if you want to trade crypto, you should research and you should validate what you are
03:45
Speaker A
applying. Also, because markets change, there is one concept called alpha decay. And as the reason to help you in doing this, I'm providing for free here five structural edges that are supported by extensive academic research, data, and track record from the biggest
04:03
Speaker A
institutions in the world. Let's start with the first one. The concept of earnings surprise drift. The earnings surprise drift, the PAAD, the behavioral underreaction anomaly, post quarterly announcement, is one of the oldest edges in the stock market, and it's proven by
04:23
Speaker A
a lot of tests. Now, this edge here works because there is one concept in the institutions and in the hedge fund called alpha execution. So, when you have a sudden change in information in the market because maybe one stock beat
04:39
Speaker A
the expectations in the earnings by two, three times, by 40, 50, 60%. Okay? This information needs time to be priced in because the market participants are not willing to suffer a huge amount of slippage. So, they will fractionalize
04:57
Speaker A
their order, and one example of this, one alpha execution method that I was also discussing with Freddy, one ex-market maker, is the VWAP. Okay? So, they put algorithmic in the market where they will buy the stocks they are
05:11
Speaker A
interested in because there was a sudden shift in fundamentals at one specific price. They will accumulate, okay?
05:18
Speaker A
Without rushing and running after the price where you pay a lot of slippage, okay? And when you have an average feeling price that is not so good, okay?
05:28
Speaker A
The earnings surprise drift represents one of the oldest, most robust market anomalies. It's firstly documented by Ball and Brown in 1968, and it shows that stocks with high standardized unanticipated earnings continue to drift upward for up to 60
05:46
Speaker A
days, while negative surprise stocks drift downwards. Investors anchored to previous estimates suffer from limited attention during busy earnings season, leading to slow information diffusion and delayed price adjustment.
06:01
Speaker A
Underreaction is reinforced by transaction cost, short sale constraint, negative surprise small gap, and liquidity limits. These include also slippage, preventing institutional traders from instantly correcting the mispricing. And this is where the edge for retail works, okay? And this is why
06:20
Speaker A
it's present for multiple years. So, you start with a hypothesis and you build the structural mechanics. Now, let's go on this. This is one chart that shows the spread, okay, for a sample of positive earnings, the good news and the bad
06:35
Speaker A
news. And as you can see, the stock drifts in the direction of the earnings in the next 60 days. This is day one, this is 60 days, okay? The spread is relevant, the spread is 4%, okay? And for 60 days, 4% in a single stock is a
06:49
Speaker A
lot. Specifically, if you also do statistical analysis on the stock that you are picking. If you want to check by yourself, you are a nerd and you want to read, go check this verified academic research from Kaczmarek and Zaremba,
07:05
Speaker A
Beyond the Last Surprise, Reviving Post Earnings Announcement Drift with Machine Learning. This one is beautiful from 2025. And the second one from Bernard and Thomas of '89, one of the oldest ones, Post Earnings Announcement Drift, Delayed Price Response. Let's go on the
07:23
Speaker A
second edge. The second edge is my favorite, okay? Everyone knows me for the IVB. I validated this from an institutional perspective with multiple platforms also on Python to show that the stocks have an upside skew and they have
07:37
Speaker A
a structural drift of the battle of the first 30 minutes. We also received a test and audit from an ex-market maker, Matteo Conti, that did a super extensive test on this behavior and validated this also. By the way, if you want this
07:52
Speaker A
flowchart, you can click the link in the description because I will share it in the Telegram channel, completely for free. The core edge, the initial volume breakout or the initial balance drift, and there is a huge amount of literature
08:05
Speaker A
also without implementing volume of the opening range breakout, so just using price. Okay. The initial balance represents the high and low price established during the first 30 minutes of a regular cash trading. Volatility contraction during this first half hour
08:21
Speaker A
often revolves in explosive volume confirmed directional breakout runs that hold strong predictive power for the rest of the session. Now, let's start on the assumption of without considering volume, just considering if the Nasdaq has a structural drift on the upside
08:42
Speaker A
and if the opening range of the first 30 minutes holds predictive value over the coin flip. And we can see that we have a skew of 13.5%, okay? So, measuring the session after the breakout that closes above this
08:59
Speaker A
breakout, it's already blindly without order flow, without option flow, without logic of the strategy confirmation 13.5%, okay? So, with the risk to reward okay of one of
09:18
Speaker A
right just from this valuation okay. Then I did extensive test also with the quant, we saw how this edge perform in the last 5-10 years and how you can take both side because you can also implement the short side okay that is more strong
09:33
Speaker A
but you should be able to analyze the gamma regime because in this one option flow comes really handy. And I gave also the verified academical literature, the one of Andrea Barbon, Carlo Zarattini, Andrew Aziz, profitable day trading strategy for the US equity markets. The
09:49
Speaker A
founder of this, Toby Crabel, that started with the opening range breakout without implementing volume, but it's already profitable with this logic. And the one of Holberg, assessing the profitability of intraday opening range breakout strategy. Consider order flow for timing, this is what Getting a
10:06
Speaker A
direction validated by statistical research and then timing my entry with order flow and option flow for directional pressure. Let's go on the third edge, asymmetrical information and regulatory filing. Politician tracking, okay? Member of Congress frequently trade stocks in sector directly impacted
10:25
Speaker A
by committees they sit on. Speaker Emerita Nancy Pelosi's family portfolio has achieved legendary status, outperforming nearly every hedge fund with 54% gain in 2024 and a 65% gain in 2023, primarily through leverage call options on high growth tech stocks. Now,
10:45
Speaker A
the hypothesis, key politician have access to non-public forward-looking information regarding federal contract, regulatory changes, subsidies, and antitrust decision before they are made public. Structural mechanics, while the Stock Act of 2012 mandates trade disclosure within 45 days. Copy trading
11:04
Speaker A
the most active and powerful committee members create a structural alpha edge. These politician possess asymmetric insight into macroeconomic policy policy shift like the CHIPS Act or the green energy subsidies. Now, to avoid cherry-picking the politician, we test Nancy Pelosi, Brian Higgins, and Mark
11:23
Speaker A
Green portfolio. And as you can see, we compare this with the buy and hold on S&P 500, and you can see the result of this equity line comparing Nancy Pelosi, Brian Hicks, and Mark Green to the S&P 500 results. You can see that Nancy
11:38
Speaker A
Pelosi is the best performer. Okay. And we can go on the verified academical literature. This one of 2011, abnormal return from the common stock investment of member of the US House. And this is why in the 2012 they created the STOCK
11:54
Speaker A
Act exactly for what this paper was demonstrating. And the one of Fisher, talking stocks of democracies, abnormal returns of high-profile member of Congress. This is from 2025. So, remember that the edge are not only price, volume, okay, or data. They can
12:14
Speaker A
also be informational edge in timing. And this edge can be taken as a structural alpha even if there is this delay of 45 days between the release of the information and the actual result of the price. Let's go on the next one, the
12:31
Speaker A
option premium harvesting. And this is also another structural edge, capitalizing on the systematic volatility risk premium, the VRP.
12:41
Speaker A
Abstract, option premium harvesting is the systematic selling of out-of-the-money option to capture the volatility risk premium. The volatility risk premium exists because implied volatility, listen closely, implied volatility, IV, is structurally higher than ex-post realized volatility, the RV. Hypothesis,
13:02
Speaker A
implied volatility represent a risk insurance premium that institutional buyers are willing to overpay to hedge their downside risk, allowing option sellers to collect a persistent yield.
13:15
Speaker A
The risk premium is a structural compensation for taking on tail risk because markets are crash phobic.
13:22
Speaker A
Out-of-the-money puts trade at a premium that significantly exceed their mathematical probability of expiring in the money. Here you can see the test, okay, of the last 12 months of the difference between implied volatility and realized volatility. You will see
13:38
Speaker A
with your own eyes that realized volatility it's more often than not lower than implied volatility. And here are two papers that I find amazing, the current rule from 2009 variance risk premium and the Oleg Bondarenko, why are put options so expensive?
13:57
Speaker A
The last edge, this one is the edge that gave me the most amount of results during the years because it was really early in the blockchain adoption and in the Bitcoin cycle.
14:09
Speaker A
And now there are a lot of papers that are coming out about the smart DCA on the crypto space. This is the blockchain intelligence model. So, optimizing Bitcoin accumulation using the MVRV zeta score versus the buy and hold. Now, this
14:25
Speaker A
one it's a simplification to make it quantitative. I have my own model that have even better performance than this that is based on multiple set of mathematical condition before pressing buy and before selling the Bitcoin. A standard buy and hold strategy expose
14:42
Speaker A
investor to maximum drawdown exceeding 80% and if you study the retracement from the all-time high of Bitcoin, you notice. The blockchain intelligence model use the market value to realize value, the MVRV zeta score to identify macro market cycles and adjust
14:58
Speaker A
allocation size dynamically, buying heavily at capitulation and reducing risk gradually at euphoria. And if you study the biggest portfolio in the market, you will notice that this is exactly how the big whale of the market move and you can monitor this by
15:14
Speaker A
checking their holding activity. The hypothesis, public blockchains provide a transparent, real-time record of investor cost basis, the realized value.
15:24
Speaker A
Standardizing the difference between market value and realized value reveals the extreme deviation from fair network valuation. Structural mechanic, because Bitcoin lack traditional cash flow anchors, price cycles are driven entirely by purely behavioral reflexivity. The MVRV zeta score standardized this psychological swing,
15:44
Speaker A
flagging absolute capitulation and extreme euphoria. Empirical equity line, this is the comparison between the dynamic the one on the MVRV, the static DCA, and the buy and hold approach. And below, we can see the Grobity and Nazman Sandretto 2026 using on-chain data to
16:04
Speaker A
predict Bitcoin cycles, and the Nazman research paper about using on-chain data to predict cryptocurrency cycles. I hope you find a lot of value in this video.
16:16
Speaker A
Test these models and let me know if you find any edge. I hope it helps you to realize the important of diversification and the importance of starting with an hypothesis.
Topics:trading edgesearnings surprise driftinitial volume breakoutintraday tradingstock market anomaliesquantitative researchcrypto smart DCAfinancial marketsinstitutional tradingalpha generation

Frequently Asked Questions

What are the five structural edges discussed in the video?

The video covers two long-term stock market models including earnings surprise drift, one intraday equity model called initial volume breakout, one options model, and one cryptocurrency smart DCA strategy.

Why is diversification across multiple trading models important?

Diversification helps traders remain independent of market regime changes, reduces panic and revenge trading, and smooths equity performance by not relying on a single strategy.

How does the earnings surprise drift create a trading edge?

Earnings surprise drift occurs because institutional traders execute orders gradually to avoid slippage, causing stock prices to drift in the direction of earnings surprises for up to 60 days, creating a predictable anomaly.

Get More with the Söz AI App

Transcribe recordings, audio files, and YouTube videos — with AI summaries, speaker detection, and unlimited transcriptions.

Or transcribe another YouTube video here →