My Signature Orderflow Model — Transcript

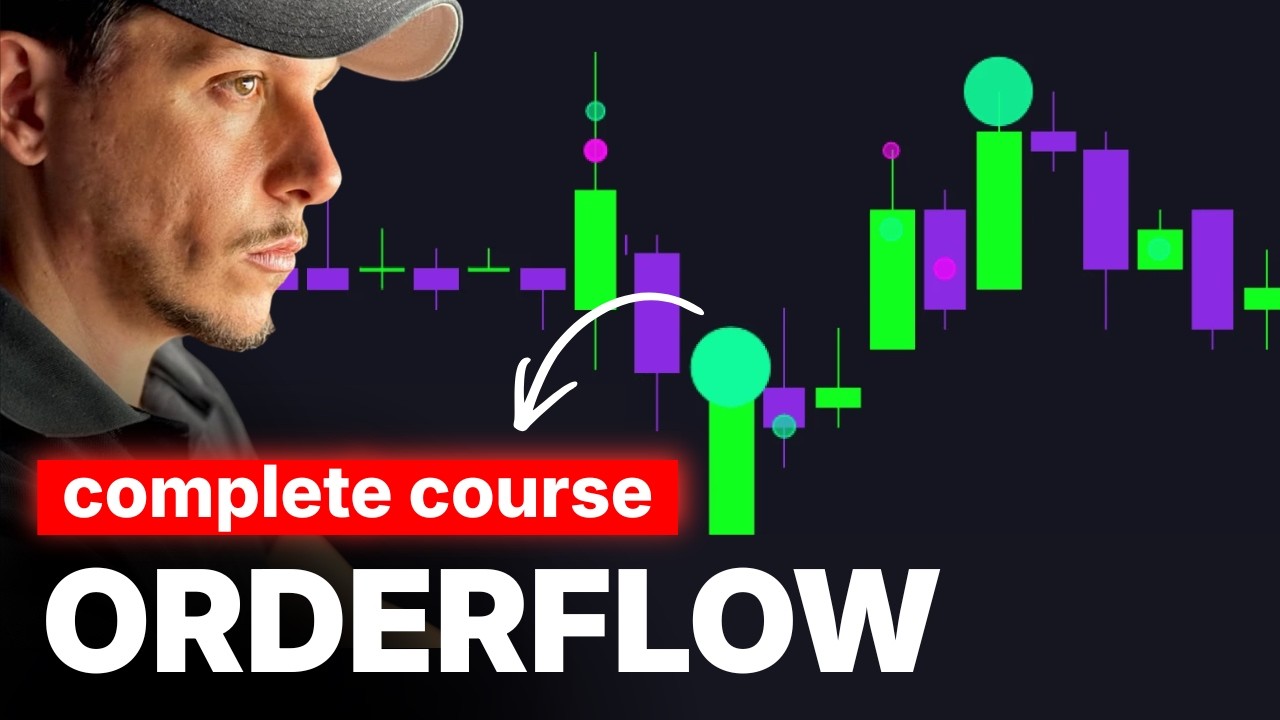
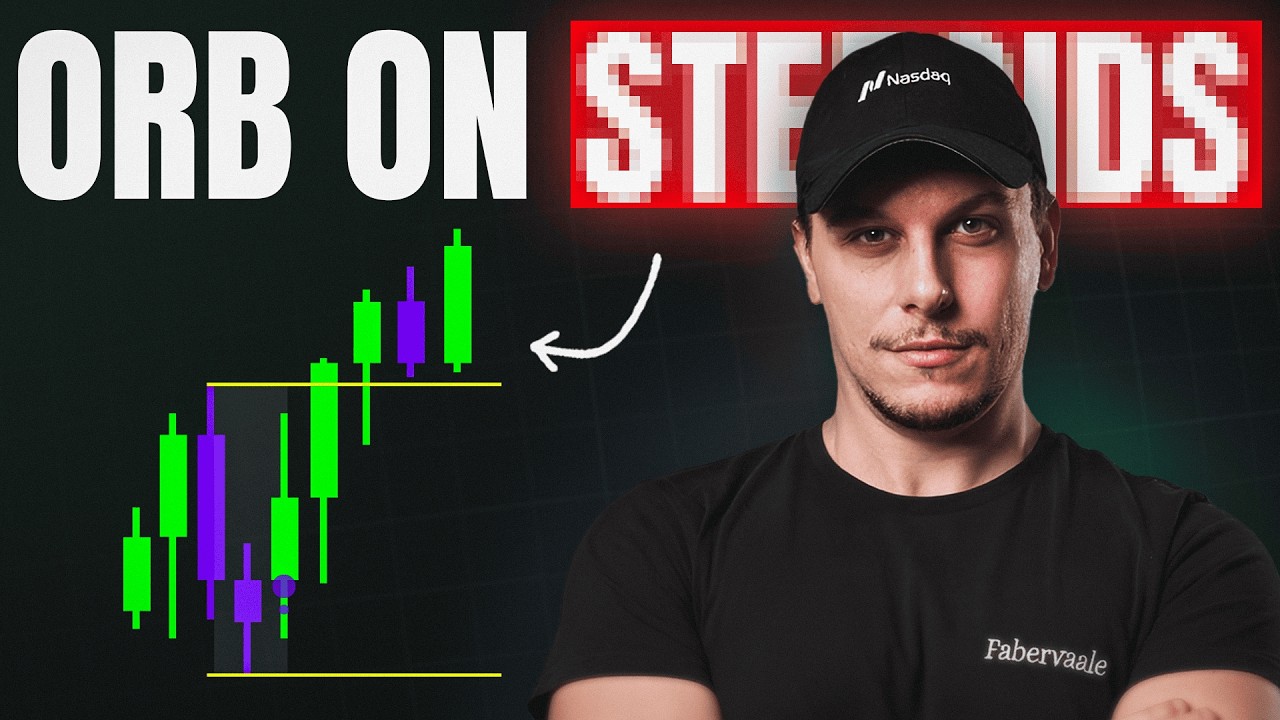
Fabervaale presents a proprietary order flow trading model using volume and price analysis for high-probability trade setups.

Key Takeaways

  • Order flow and volume analysis reveal the path of least resistance in price movement.
  • The law of effort and results is central to understanding market aggression and absorption.
  • Using the model with daily bias and profile framing improves trade accuracy and risk management.
  • The model offers clear trade triggers and areas for entry, stop-loss, and profit-taking.
  • Deep Charts platform exclusively hosts this proprietary model for enhanced order flow trading.

Summary

  • The video introduces a proprietary trading model based on granular order flow data developed after years of research.
  • The model identifies the path of least resistance by analyzing volume and price to find high-probability trading areas.
  • It is integrated exclusively into the Deep Charts platform as part of their research and development program.
  • The methodology is rooted in Volume Spread Analysis (VSA) and the law of effort versus results, balancing volume and price impact.
  • The model filters noise and generates actionable trade triggers aligned with directional bias and price action.
  • Trade management strategies include multiple profit targets and smart stop-loss placements based on model signals.
  • The video demonstrates the model’s application on NASDAQ sessions, highlighting consolidation and directional phases.
  • It emphasizes the importance of trading in line with the daily bias using profile framing to improve trade success rates.
  • The model helps identify absorption patterns, momentum setups, and potential reversal points for better trade precision.
  • Overall, the model provides traders with a clear edge by combining volume, price, and order flow granularity.

Full Transcript — Download SRT & Markdown

00:00
Speaker A
In this video, I will show you a proprietary trading model that I've built after years and years of research.
00:08
Speaker A
This study uses granular order flow data to spot where volume is effortlessly moving price. Hence, where is the path of least resistance? I use this edge as part of my daily trading routine, and I have done extensive quantitative validation around it. I will show you
00:32
Speaker A
how to use it and contextualize with deep trades to take the highest probability areas as a part of my contribution to the deep charts research and development program. I worked in the role of alpha research to make it
00:49
Speaker A
available exclusively on deep charts. And now let's go through the deep effort together and understand the logic behind how it works and why this is an amazing tool to get more precise using order flow. I come from a study called
01:06
Speaker A
volume spread analysis, the VSA. I started this study when I was using vertical volume to refine the area of confirmation using the relationship between volume and result of price. If I have a wall of orders here and I have
01:24
Speaker A
the price striking here with a lot of volume, I see that there is no result.
01:29
Speaker A
So no follow-through of all this effort, and the effort is going on. This one for me becomes an area, becomes a potential point of reversal, becomes a level that I want to notice. At the same time, if I
01:45
Speaker A
see the market doing an amazing movement with really low effort, okay, on the buy side, and I see buyers interacting really aggressively to break this level, and then I see low effort to make an amazing result, what the market is telling me
02:01
Speaker A
is that the balance between forces here changes, and now the path of least resistance is on the buy side. It's like a traffic light that gives me areas and gives me situations where the edge is on my side in a specific moment of the
02:17
Speaker A
chart. And the logic behind it was built because when you use volume analysis, for example, you can get into consolidation areas, and you can try to execute multiple times, taking a lot of breakeven. So the logic behind was I
02:34
Speaker A
only want levels where everything is telling me that one side is more aggressive than the other. So having a directional edge and a specific area edge. So I can have a clear stop-loss in the direction of the model. For example,
02:52
Speaker A
you can pair this with the statistical model of IVB. Now all this logic behind that you can use here is based on one simple order flow concept. And this concept is the law of effort and results. And this is really important
03:11
Speaker A
because you need to understand that volume and price give you two different pieces of information. The volume is telling you how many orders are entering. The result is telling you how much these orders are having an impact on price movements. So
03:30
Speaker A
if we are here, for example, on this floor and we see aggressive market participants striking on this level with a huge volume, and we see that every time the maximum they can do is sprinting weak, I will not consider a continuation
03:48
Speaker A
because I see that this level is getting really interesting from a passive participants' perspective. They are keeping all these orders. Okay, they are absorbing here. This is a usual pattern of absorption, and this one comes also from the volume spread analysis. So you
04:05
Speaker A
are not considering only one side, only price, but you are taking also into consideration the volume. At the same time, on the other way, when we see aggression of the buyers and at the same candle aggression of the sellers, and we
04:20
Speaker A
see that the sellers are completely absorbed and the buyers are rewarded, what the market is telling us here is that in this battle they have maybe the same effort, but the result is heavily skewed on the upside. So what I can do as
04:37
Speaker A
an analyst, I can understand that the probability that we continue higher, so we go to tap into this eye, is the biggest one. But the effort is the same.
04:46
Speaker A
Maybe you have the same effort from aggressive buyers and aggressive sellers, but the sellers are completely absorbed. So we need to put this and to frame this into one single law: the law of effort and results. And the step that
04:59
Speaker A
we did later was how can we make sure that this is transferred into one script and that is taking into consideration everything. And after this study came out, the logic of putting in relationship price, volume, and putting also in relationship the granularity of
05:19
Speaker A
the order inside. And on this, we have a proprietary model that is capable of filtering all the noise and is giving you what I like to call triggers.
05:29
Speaker A
Triggers to potentially execute, and it's giving you an edge when you have, for example, framed your area, your point of interest maybe using price action. You see everything and you approach the level back again here, and you have your
05:44
Speaker A
deep effort telling you, look, from this moment we are skewed on the downside.
05:49
Speaker A
So you have your area, and what this is telling you is that the probability from this box on is to continue lower, and this can be amazing also for profit taking because when you see an opposite area on the buy side, you can understand
06:04
Speaker A
that now this selling pressure is almost exhausted, and the probability instead of continuing that you will go up to this level is higher. So the consideration that you can make is that it's not worth to risk all this profit
06:18
Speaker A
that I make just to make an additional small movement by risking all this profit. So I take out my position, and what I do, I consider putting stop below.
06:28
Speaker A
So if the market wants to continue, I'm into the position again. I took profit on the first one, and I have my liquidation here. This is a smart way of managing trades. Now let's go to the chart and let's understand together how
06:42
Speaker A
the deep effort is giving you an edge. We are in NASDAQ on this week, and we will see some sessions where you have a consolidation phase, some sessions when you have a directional phase, and we will understand how much this is powerful
06:57
Speaker A
when paired with logic of regression and logic of bias of the day. So the bias for the 26th and the bias for the 27th was long.
07:08
Speaker A
So I had a clear bias for the day, and for this, I use profile framing. So all the short setups, if I have a bias, I'm not interested in taking. Okay. So I can save the counter-trend setups. Amazing.
07:23
Speaker A
As you can see, we start giving you areas where the buying pressure is dominant. From this, we have an overlap of two clusters here. This one is the first area that the model identifies aligned with the long term. So you can build from here
07:39
Speaker A
the first positions as a trigger in the direction of the overall trend. Now, not all the days will be so directional. So it is smarter to have multiple profit targets. One position you take out, for example, at 50% of the full profit, and
07:55
Speaker A
the other one you leave a runner. The second area that gave us is this one.
08:00
Speaker A
This one is a momentum setup. Why momentum setup? Because it closes above it, it never tests. So this one you couldn't take because the market doesn't give you a test here. It gives you an area, immediately tests, gives you another
08:12
Speaker A
area, immediately tests. So you could make a lot of trades on this one. Then you have a small stop-loss here because even if you are right on the direction, if you want to be precise, you need to
08:21
Speaker A
accept some stop-loss. So if we go to count it, we have, let's not consider the full take profit. Let's consider one, two, three. You have three hours here. This one is unfilled. You have minus one R here. Okay. You have another unfilled.
08:34
Speaker A
Okay. You have a stop loss here. So you have minus R. And finally, the market comes back to your area. Okay. So you have an entry point here because this is a virgin area. And the market immediately confirmed this with another
08:47
Speaker A
area that unfortunately is unfilled. So let's consider this small cluster of setups. You took six hours of profit.
08:55
Speaker A
Okay. And you lost two. You are four positive just by taking setups in line with the direction bias of the day with profile framing. Now also this day, as I explained to you, I was long in
09:08
Speaker A
bias from profile framing. So the volume profile is telling me that the pressure is building on th
09:20
Speaker A
consider the market from this one. And as you can see this area, it's amazing because it give me exactly the pressure.
09:28
Speaker A
What's unfortunate here that these two setups are unfilled because the market is so aggressive that is snap back really high. The first setup that I will be able to take is the test of this virgin area. This one would have been an
09:40
Speaker A
amazing one to three risk-to-reward and you close the day with only this setups. So you need to take into consideration that there will be days where you don't have any setups. Okay. Also for this day here I am long in bias. Okay. So when we
09:55
Speaker A
open the New York session here, okay, I have one setup that it's some filled unfortunately here and then I have another setup that it's filled. So I have one stop loss in this area and then the markets break the structure. This is
10:09
Speaker A
the beginning of the range. So when it breaks on the opposite side using the deep effort, I don't go trend counter trend on this one. So I need to wait that we have another confirmation of directional. But unfortunately this day
10:22
Speaker A
we never go back to this level till late in the session. Look how much this would have been amazing with these setups.
10:29
Speaker A
What's the problem that we are late in the night? Okay, this would have been like six take profit at once. But this was not viable for me because we broke below the initial balance. And as you know I like to pair the NASDAQ effort
10:43
Speaker A
with the IVB model. So you need to keep in mind a profile framing or IVB directional bias paired with the deep effort to give you a confirmation. I want to show you this setup even if this one are not executed because I want to
10:58
Speaker A
show you how the market is not identifying momentum candle but it's identifying for you areas that are potential strong point retest. This one have been retested perfectly. This one have been retested perfectly. This one have been retested perfectly. And in
11:14
Speaker A
situation of long momentum, it's not so difficult to take amazing risk-to-reward by covering below the areas. Okay.
11:23
Speaker A
Unfortunately, when they are outside the timing or counter trend in respect to the bias, we don't take it. This is was denied. I hope you enjoyed the video.
11:31
Speaker A
See you on the next one.
Topics:order flowvolume spread analysistrading modelproprietary tradingdeep chartsvolume analysisprice actiontrade managementNASDAQ tradingmarket absorption

Frequently Asked Questions

What is the core concept behind Fabervaale's trading model?

The core concept is the law of effort and results, which analyzes the relationship between volume (effort) and price movement (result) to identify the path of least resistance in the market.

How does the model improve trade accuracy?

The model filters noise from granular order flow data and combines it with volume spread analysis and price action to generate high-probability trade triggers aligned with the daily directional bias.

Where can traders access this proprietary order flow model?

This proprietary model is available exclusively on the Deep Charts platform as part of their research and development program.

Get More with the Söz AI App

Transcribe recordings, audio files, and YouTube videos — with AI summaries, speaker detection, and unlimited transcriptions.

Or transcribe another YouTube video here →