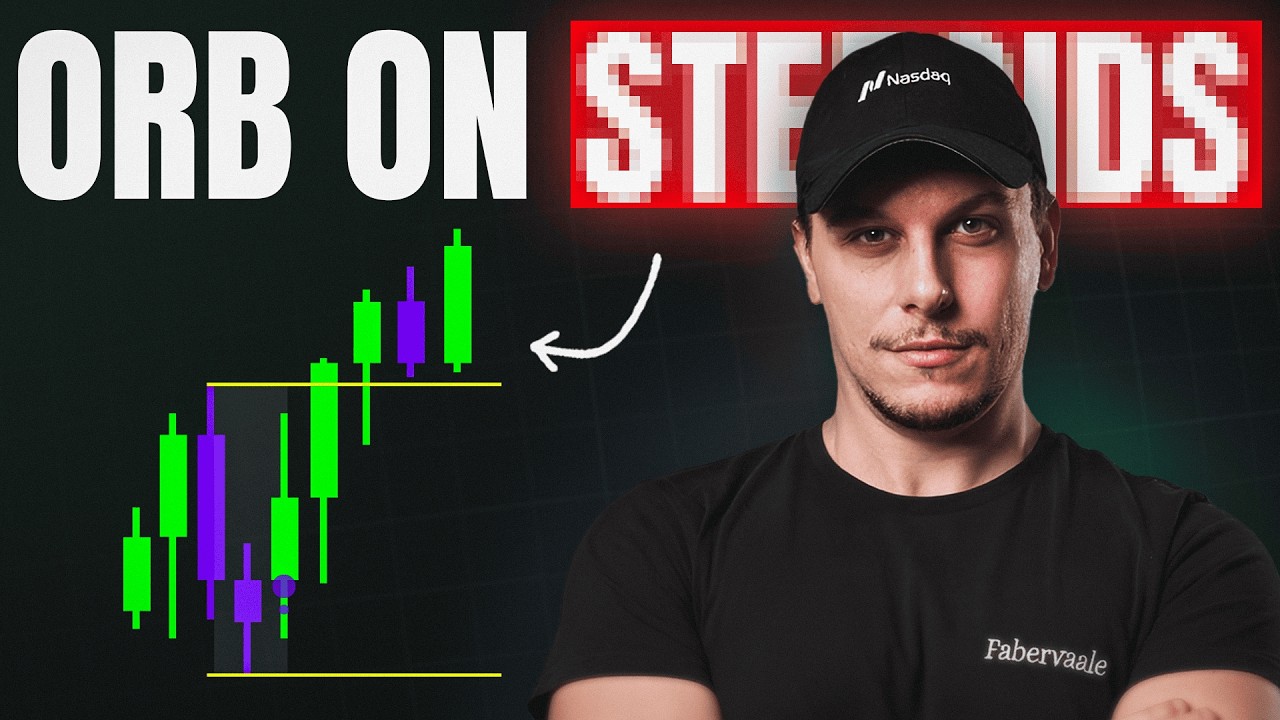
The Only Orderflow Guide You’ll Ever Need — Transcript

Comprehensive guide to order flow trading, explaining buyer-seller interactions, market orders, and institutional strategies for profitable trading.

Key Takeaways

  • Order flow provides deeper market insights by showing real-time buyer and seller interactions beyond price action.
  • Market orders guarantee execution but have price uncertainty; limit orders have price certainty but no execution guarantee.
  • Price moves when aggressive orders consume passive liquidity, and slippage occurs if liquidity is insufficient.
  • Understanding order flow helps traders identify key support and resistance levels and the path of least resistance.
  • Institutional traders widely use order flow techniques to follow smart money and improve trading profitability.

Summary

  • Introduction to order flow and its difference from price action by showing real buyer-seller interactions.
  • Explanation of market forces: aggressive participants (market orders) and passive participants (limit orders).
  • Detailed examples of order book dynamics and how price moves based on order execution and liquidity.
  • Discussion on price slippage when market orders exceed available liquidity at best bid/ask levels.
  • Clarification of execution authority and price certainty differences between market and limit orders.
  • Live demonstration of order flow using the Deep Charts platform showing aggressive orders impacting price.
  • Identification of key price levels where buyers and sellers control the market and how this affects price movement.
  • Explanation of the path of least resistance concept in price movement based on order flow.
  • Overview of institutional trading behavior and how to follow smart money footprints using order flow tools.
  • Use of auction market theory and volume profile concepts to enhance order flow trading strategies.

Full Transcript — Download SRT & Markdown

00:00
Speaker A
In this video, I will teach you from scratch what order flow is and how you can use it in your trading. Order flow, unlike price action, uses a deeper level of information. It uses charts that show you real interaction between buyers and sellers and the battle between big traders and institutions that happens in the market every single day. This is a trading style that is widely known and used in the institutional trading space and that I've used to trade live in front of millions of people all over the internet and to trade profitably my personal account over the last decade.
00:17
Speaker A
In this complete guide, we will start from what order flow actually is, how order flow creates price movements, and how you can read order flow in real time to find the best trading setups. And I will show you my favorite order flow tool that allows me to filter out only the big traders to truly follow the footprint of the smart money in the market. Let's get started. By the way, I will share with you this entire map on my Telegram channel. Let's start by
00:34
Speaker A
understanding what the market is. So, the market is made by the interaction of two forces: the intent to buy and the intent to sell, routed through a central exchange for regulated markets and represented as volume. Now, let's see
00:42
Speaker A
how this interaction unfolds. We have two types of forces in the markets: the aggressive participants and the passive participants. And in this example, you can see on the right side the order book and on the left side the market orders.
01:00
Speaker A
Now, let's assume that a market order to buy 25 contracts is about to hit the book. And these aggressive buyers are accepting the prices by the best ask, the so-called passive sellers, the passive forces that we saw before that
01:16
Speaker A
are providing 33 units at a price level of 101. Now, the 33 units of passive sell orders are sufficient to satisfy the 25 buy market orders that are the aggressive forces, and after execution only eight sell orders remain in the
01:33
Speaker A
best ask and the price moves up to 101. Price is now here. Here we can see a new candle with the order flow tool that represents the executed order called the footprint and a record, a detailed record of what occurs on both the bid on
01:50
Speaker A
the left side and the ask on the right, and it provides a list of all the aggressive sellers who enter the market and on the right all the aggressive buyers that join the action. Now, the 41 passive buy orders are sufficient to
02:06
Speaker A
satisfy the interaction of the 25 sell market orders, and after the execution there are 16 contract buy orders that remain in best bid and the price moves down to 99. The footprint now has recorded both the 25 executions
02:26
Speaker A
that we saw before and the sell order that we see executed on the horizontal level 99. Now, in the previous case we have seen how the price moves and interacts when the best bid and ask are able to satisfy the market orders that
02:43
Speaker A
are coming. Now we need to see what happens when the best bid and ask are insufficient to fulfill the demand. So when we see 75 aggressive participants' market orders that enter here, what happens to the market? And in this case,
03:01
Speaker A
the 75 buy market orders found only eight contracts on the 101 level, so the best ask, and they move directly to 102 to fill the remaining 67 contracts. And you have a reflection on this on the footprint that shows you the executed
03:20
Speaker A
order of 25 on the 99 and 32 on the 101. So we move to the 102 level with 67 contracts of aggressive market participants. The 102 level doesn't have enough sell limit orders to be able to satisfy the buy market demand, so
03:37
Speaker A
considering the order matching execution moved to the next level available, that is 103. So we have in the end on the footprint we have 32 executions on the 101 level and 42 contracts executed on 102 level and we are moving to the next
03:55
Speaker A
level that is 103. In this case, the 75 aggressive orders that we saw in the beginning received and experienced a slippage of three ticks going to be filled completely at the 103 level with 31 remaining contracts available. So to
04:16
Speaker A
summarize, we have two forces that have different features. We start with the passive forces, the limit orders that have pricing authority and price certainty because they choose the level where they want to be filled but they experience the execution or certainty.
04:39
Speaker A
So they don't have the guarantee to be filled because to be filled someone else needs to accept this level. The market orders have execution authority and execution certainty because when you press buy market it's a guarantee that you will be executed but you don't know
04:57
Speaker A
where. You don't have price certainty because you can be filled, for example, you can press buy market on the 101 and be filled at 102 because maybe your order experiences execution. That's the reason they have different features. The
05:17
Speaker A
market orders have price uncertainty and the limit orders have execution uncertainty. So now we are on the order flow platform Deep Charts and we will watch some live interaction between execution, so aggressive orders and passive liquidity. As you can see now we
05:36
Speaker A
have 13 executed sell market orders at this horizontal level 6,841. And now the price is rejecting. You can see that the level of the price is getting lower. This means that aggressive sellers are executing orders at 6,841 and they are meeting the liquidity on
05:54
Speaker A
the downside and they are pushing the passive liquidity down. They are eating levels on the book on the downside. And this is the reason you are watching this interaction and price going down because as we saw before in the example and you
06:10
Speaker A
can see this also from the closure of the candle in the footprint. The candle is in the majority controlled by aggressive sell orders and is showing you also the level where these sell aggressive market orders are concentrated. That is the horizontal
06:28
Speaker A
level where you see the yellow box and the 53 aggressive orders executed. And on the book we can see on the left side that the liquidity is more thick on the upside. As you can see there are 28, 33
06:55
Speaker A
here and only 10. And this is the reason we saw exactly in real time the sweeping of the book. So the aggressive orders entering on the sell side and eating three different levels on the book. So the aggressive orders, the sell
07:10
Speaker A
aggressive orders, are pushing and eating levels of the book. Now you are seeing an interaction where we have a maximum level of aggression that is the 6,840 where the buyers are in complete control and now the auction is changing. Now the
07:28
Speaker A
aggressive market orders are pushing the passive liquidity up. As you can see sellers again protecting and we are watching the live interaction of the market. So every time we go to this level, the 6,841.5, you can see that the aggressive
07:45
Speaker A
sell orders enter back and push the liquidity level down. Now we are back to 6,840.5.
08:01
Speaker A
So you can expect that now the buyers protect this level and these aggressive sellers get absorbed completely on this level. Let's see how it goes. As you can see we have only five and 16 here and we have 23, 25, 18, 14. So the path of least
08:20
Speaker A
resistance is on the upside. This is what I call the path of least resistance and this is exactly what happened. As you can see the price reached this level, rejected, and now it's going back to the fair value of this range. Now we
08:41
Speaker A
are watching this interaction in the London session. So there is not a huge amount of volatility and interaction between participants but as you can see we saw the horizontal level of control of the sellers that is the 6,841.5
08:50
Speaker A
and the horizontal point of control of the buyers that is the 6,840 and this is the range where they interact and this is the range where you see that the interaction between aggressive and passive orders shift.
09:08
Speaker A
gift. So from the example that we saw before, we understood the two forces and we understood their role. The role of aggressive market forces is creating pressure, okay, moving the market and the role of passive orders is creating
09:20
Speaker A
resistance and you can see this by observing the book. Let's make this example. Okay, we ha
09:39
Speaker A
and the horizontal point of control of the buyers that is the 6,840 and this is the range where they interact and this is the range where you see that the interaction between aggressive and passive orders shift.
09:53
Speaker A
gift. So from the example that we saw before, we understood the two forces and we understood their role. The role of aggressive market forces is creating pressure. Okay, moving the market and the role of passive orders is creating
10:13
Speaker A
resistance and you can see this by observing the book. Let's make this example. Okay, we have 122 total contract on this block here on the book and we have a total of 273 on this part. Okay, which part do you
10:32
Speaker A
think will be more difficult to pierce from the side of aggressive market participants? Of course, this one is the easier side to pierce. This one is the more difficult. Why? Because this one hold more resistance from passive market
10:53
Speaker A
participants. So you need a lot more aggression to pierce through this. Let's go on and let's understand in this example that from the concept of pot of list resistance, it's easier for the market to continue higher here and
11:13
Speaker A
pierce through this passive orders instead of breaching through this level. The concept of probability and the concept of what's easier doesn't mean that it's always like this. But it's an information that we can use. In this example that we have here, we have a
11:32
Speaker A
breakdown of forces. We have buyers on the right side, the sellers on the left side. And here we can see a huge effort on the top from the buyers to break this level that got completely absorbed by passive forces. The sellers on the other
11:52
Speaker A
side received a lot of result more because they did less effort to achieve more results. The candle close sell here. So we have a short candle with less less effort from the sellers and a lot of effort from the buyers that
12:09
Speaker A
received zero reward. This is the perfect case of absorption. Why? Because you have no reward for buyers and you have a lot of buy pressure. Probably this candle will have positive delta but negative closure. This is the textbook
12:27
Speaker A
example for absorption. Let's see now an an example of aggression. So high effort and high results. You have the same breakdown. So on the right of the candle you can see the aggressive market participants uh on the buy side and you
12:43
Speaker A
can see that this strong move on the upside had a lot of effort backing it and they got also rewarded. probably here we see a lot of levels from book that got swept and we managed to close with a full green candle. It means that
13:01
Speaker A
in this case the big buy effort got rewarded and you have what we call an initiative auction and a confirmation of the aggression of the buyers. So in this case you can probably guess that in the balance of forces buyers won the battle
13:21
Speaker A
and it's more it's higher probability to see a continuation on the next candles. Now let's go through an example of book sweeping. So low effort and high result.
13:33
Speaker A
In this case we see a lot of executed orders on the bottom side of the candle and then we see a candle that close with an amazing reward. So there is movement of the candle but there is an absence of
13:45
Speaker A
participants. So we can see that there are no sell limit players in all these area. There are but they are few and price moves but not the money. So in this case we saw an example where the effort is low and the result is high
13:59
Speaker A
because in this case in this area that I'm lining up for you there were no sell limit player. So a small aggression from the buyers swept multiple levels of the book. Now let's introduce a new concept that is called delta. Delta is the
14:19
Speaker A
difference between aggressive market participants on the buy side and aggressive market participants on the sell side. So it's the different on the horizontal level from aggressive sell and aggressive buy market participants.
14:33
Speaker A
And we can have two different representation of this information. We can have an horizontal visualization and we can have a vertical reference for the delta on the left side. What we are seeing here it's a delta footprint profile and we can see for example that
14:51
Speaker A
the delta it's really high from the point of view of the sellers on the downside but the candle close by. This is the perfect absorption example that you can see from delta footprint profile on the right side. If you want to use
15:06
Speaker A
the vertical delta information, we have a market that is in a consolidation phase here and we can spot that all these aggressive market participants here got absorbed and the candle close green. This is a potential continuation of the move and an absorption pattern
15:25
Speaker A
that you can spot using the delta per candle in a vertical pack of data that it's available on deep charts. And this one needs to be set because usually you will find the footprint on the left side that is showing you the bidden dusk. You
15:43
Speaker A
can set by choosing the difference between them and it's called specifically delta footprint. Now let's see an example of initiative auction. So a concept that is usually representing followup and reward. In this case we can see from the executed order a constant
16:01
Speaker A
aggression of the buyer. So there is consistent pressure on the upside one side print that is also called imbalance and you can use as a really strong point to join the trend when it's developing and you have a strong delta. So you have
16:15
Speaker A
coherence of information a strong delta and a candle that close on the upside and in this case you can see that is the delta that is leading the price on the upside. This is the best example that you can have of aggressive momentum and
16:31
Speaker A
it's represented by what we call initiative auction that can also be spotted when you have an outline from the vertical volume with a reward from the close of the candle. So the market is telling you the price is closing on
16:46
Speaker A
the upside. So you have an actual result and the volume is supporting this movement closing above the average. This is aggressive market participants putting the feet on the gas and joining the trend on the upside and it's usually
17:02
Speaker A
an amazing signal if you are a trend following trader. Now let's go through an example of absorption and we can see here that we have an absorption in the middle of the candle. Okay. And we have a value so an efficiency and the price
17:19
Speaker A
is the white line that we can see here. And we have a sudden drop in the delta when this big aggression arrived from the market order. So the aggressive participant on the sell side and it got completely absorbed got run through and
17:34
Speaker A
uh this market order got completely absorbed on this horizontal level and the price continue to push it down and close the candle long. So you have the price going up like ignoring this small inefficiency in delta and the delta
17:49
Speaker A
follow through the price and the candle close long. This example here is the reason I always watch the matching of value and the matching of volume here.
18:00
Speaker A
So what the volume is doing what the aggressive market participants are doing and what is the result. So the correlation between the effort and the results of the player. If we go on the right, this one can be seen as a general
18:13
Speaker A
absorption because from the horizontal volume you can see a lot of effort here but the candle closed green. So what is telling us that all this input of volume delta got absorbed and probably this absorption happened here and we will
18:28
Speaker A
continue on the upside. The next example that we can have is an exhaustion. In this case we can see that there is a decreasing volume. So the aggression of the market participants from the volume standpoint is getting lower and lower.
18:41
Speaker A
And we have also a contrarian imbalance. So we have an imbalance at the top from the sellers. So you have the price going up up up not being followed by the volume. So you have this divergence and the price snap back to the value to the
18:58
Speaker A
efficiency of the market and you can see that you have a rejection here. This these signals are usually amazing opportunities to uh capitalize on a reversal trade. And from the concept of vertical volume, you can find an exhaustion where you can see that the
19:14
Speaker A
market is pushing really strong, printing another green candle, but the volume is getting lower and lower. This is a dry up in volume. And usually what you see this in a pattern order flow is that you have a sudden reversal in
19:26
Speaker A
price. Now let's go through the volume profile. Every time a limit order is matched with a market order, we have a transaction. Every successful transaction, we can visualize in a way that is distributed for each tick. And what comes out from this point of view
19:43
Speaker A
is this distribution. This distribution is the volume profile. Now when we are watching the volume profile, we are not extracting from the market information related to imbalance, not information related to aggression, but we are watching how market participants are
20:00
Speaker A
interacting from an horizontal point of view. If we go on the right, we can see that what the volume profile gave us.
20:07
Speaker A
It's a Gaussian distribution where we have the majority of the volume being exchanged in this 68% and as we move from the mean we have a condition that is called imbalance market and if we manage to go out from
20:22
Speaker A
the value area usually it's where trend start. Now going on the concept of value area. Value area is where the majority of the volume for the volume profile that you are visualizing is exchange.
20:35
Speaker A
And the value area is clearly defined by value area high and value area low. That are the points where the 68% of the volume of the distribution took place.
20:45
Speaker A
The point where you can see the maximum level of transaction. For example, if we take this level here, we can see 90 transaction happening in this level.
20:54
Speaker A
This one takes the name of the P the so-called point of control. Why point of control? Because from a fair value standpoint and from a concept related to single transaction, this one is the level that hold the most amount of
21:09
Speaker A
transaction of the day. If we are talking about the daily volume profile distribution. Now we can see that the highest density of executed transaction take place here between the value area high and the value area low and high
21:25
Speaker A
execution mean strong price acceptance. So institutions are really happy to transact in this area and big players can find a counterparty. This is the so-cal balance market condition. Now going on this type of market can be traded with multiple strategy. usually
21:46
Speaker A
strategy that fade the top and the bottom using orderflow and this market takes the name of rangebound or compression or consolidation and is the driver of the trend that is coming after. Why you need to understand this?
22:03
Speaker A
Because if you want to join the trend early in his development, you need to understand that the when the the price accept and the volume accept below the value area low or the value area high, the market participants are telling you
22:17
Speaker A
that we are in a situation of out of balance. So the accumulation or the distribution is finished and you are ready for the real move of the price.
22:26
Speaker A
Now let's go through the concept of low volume node. In our distribution of the profile, we will have some point where you can see that the price is really low. So on this level, the transaction was not so efficient. Okay, the delivery
22:41
Speaker A
was not so efficient. So the price probably jumped from one level to the other with really low volume. And this is the levels where the interaction inefficient. You have poor fields. You have dissatisfied market participants and you have low execution. no price
22:59
Speaker A
acceptance. In this case, there is an absence of transaction. These levels are usually the most important levels. If you want to hop in in an imbalance level that is acting as a rejection. So let's say that we are balancing inside this
23:16
Speaker A
condition and we manage to break and we create an imbalance here in the profile.
23:21
Speaker A
Usually the market like to rebalance the low volume node before continuing in the direction of the trend. So this area a really important area from a volume point of view because it's an area where you don't have high density of executed
23:36
Speaker A
transaction. So you don't have a price acceptance and big players cannot find counterparty there. So it's areas where you usually see a ceiling or a bottom before resuming to the direction of the auction. Now price discovery bullish move by side intent unfilled buyers due
23:53
Speaker A
to low volume. Now let's go through an example of what I was telling you here.
23:57
Speaker A
When you have a low volume node and the market goes in price discovery, you can clearly see a lot of days the price coming back to rebalance in this low volume node and using this as a pivo before resuming the direction of the
24:12
Speaker A
auction. In this case, you have a lot of unfilled buyers due to the low volume node. This one is where you can use confluence and order flow pattern to join the market direction. Now going to the auction market theory and market
24:26
Speaker A
structure. How can you define where institutions, hedge fund, banks are building value. So big market participants by watching what for them is accepted as value. You can see from here the value accepted was this. When they go in a situation of out of
24:44
Speaker A
balance, they come back and they go in price discovery on the downside and we can mark the low volume node of this previous distribution. And this is exactly where the price likes to come back in the future. We are stationary
25:00
Speaker A
here. So we accepted value on the downside. So this value area high becomes for us a strong rejection point that paired with the low volume node gives us all the market condition to join the trend using orderflow pattern
25:14
Speaker A
on this level. After this we can see that we have also a continuation setup.
25:19
Speaker A
So when the price goes above the fair value that is this horizontal line and you can use also the merge of this profile the market slides back inside the value area and you have the setup that brings the price from one side of
25:33
Speaker A
the value area to the other side. You can also try to go in price discovery if the price is strongly directional. After this we go aggressively down and we created another value area on the downside and the market start to
25:46
Speaker A
accumulate. After this we have an acceptance day. So we have a market shift in value and we print multiple levels of low volume node here. That is where the price will likely come to rebalance because this level are
26:01
Speaker A
inefficient price and volume delivery from institutions. We accept the value area here and we have our setup below the value area low joined with low volume node. And here is where we want to see what the market is telling us.
26:17
Speaker A
After this, we continue the price delivery on the upside. We have horizontal value being built. And when we go back to the value area low and down, we do what we call the hook. So they do a failed auction, they try to
26:33
Speaker A
break, they get rejected. So all this it's a rejection area. And when you go back inside, you have your continuation trade and so on. Now let's see how institutions are accepting this delivery of volume. We have the value building on
26:49
Speaker A
the upside. This is what we call the Pshapes where the buyers are really aggressive and you close the cash session on the upside. So you can expect a directional move also on the day after and we see another acceptance of the
27:03
Speaker A
value. We have the profile closing on the upside. So we expect another fading of the value area low to go high or a continuation trade where we break the value area high of the previous day. And when the the day close as you can see we
27:20
Speaker A
continue to accept value. So we only consider long position here after price having a hard time breaking the previous value area low. You can see that it also hook the value area high from the downside. And this is what we like to
27:37
Speaker A
call a fake out, a failed auction trap traders. And you can use all the tools of order flow to understand this in real time. And when you have this, usually the price slice through the value area to go to seek orders on the value area
27:52
Speaker A
low. This is one really profitable setup with high win rate. And when you shift the auction again, you have the shift here. You continue to search for position lining with the general direction of the market when the market
28:07
Speaker A
gives you a premium. This is the real concept of premium discount. When you are going lower with the value and the market gives you the opportunity to join the trend from a point that is considered expensive in the distribution
28:20
Speaker A
of the volume. You have a trade that you can join bringing it to the value area low or projecting it for additional price discovery on the downside. This is the institutional reference on how to analyze the bias using volume. So actual
28:37
Speaker A
executed orders not theory and this should be your starting point to build your bias to confirm with all the order flow tools. So now let's go in the chart of NASDAQ. We are using a template of deep charts that is representing the
28:54
Speaker A
volume profile specifically the cash session of the volume profile because it's giving us the majority of the volume of the day and I only trade in the New York session for US indices because it's where the majority of the
29:07
Speaker A
volume get traded and I find it from statistical validation the London session to be usually for US indices not so valuable to add to the profile. So I only use the cash session profile. Now going through single example, I want to
29:23
Speaker A
break down for you everything that we saw live with the students of deep charts from a profile framing approach and we will go through the last two months of volume and price. So from the 20 of November to the actual price
29:39
Speaker A
action. of the full two months from the point of view of profile and we will see what information was this volume distribution giving us in terms of bias.
29:50
Speaker A
We'll start from here and we can see that we will take this as the first reference. Okay, we have a value area here. So the majority of the volume gets traded here and we will treat this as a
30:01
Speaker A
neutral information. Okay, now after this the market tell us they accept value. We have a strong move up. This is a P shape. So the buyers from daily point of view are in control of the movement. You can see that also the PC
30:17
Speaker A
it's higher. It's located above the 50%. This means that this movement is really aggressive and you have a clearly defined value area low with all these rejection on the downside. The gray area is all the rejection. So where the price
30:33
Speaker A
never accepted and this part is below the value area low. This usually act as support. So we want to mark it in green.
30:41
Speaker A
The bias is long. It's clear. We have uh a clear rejection area that is the value area low and all this absorption that happened during the cash session of this day. Okay. The day after the market tried to break from the downside but
30:58
Speaker A
reject exactly below the value area low in their rejection point. So the gray area where they accumulated and absorb the movement the day before closing exactly at the same level. So these two profile can be merged. You can merge
31:14
Speaker A
them and you can see one piece of information because when they are overlapping on the same level they are just telling you that they stayed in this balance area for two days. After this we have an acceptance the day after. Okay. We have
31:31
Speaker A
a higher pocker value area highi and we have a really strong movement. As you can see this is a double distribution profile where you have a really thin low. The first point that is interesting is where the value area low is located
31:44
Speaker A
and then you have a big profile on the upside that where the majority of the volume got traded. So you can mark all this rejection area from the downside and as you can see the price stays stationary the day after it stays
31:59
Speaker A
inside. So what you can do, you can do from here merge and do a double day profile on a single level and you can have a really precise value area low point. The day after the market accept higher and comes to rebalance from the
32:18
Speaker A
horizontal level here exactly on this level the 25,500 that is a psychological level and these two profile that you can see here are on the horizontal level so you can also merge both of them.
32:33
Speaker A
Okay. And as you can see the auction is really clear. This was amazing long trade. After this you have three profile on an horizontal level also we can merge them and you can identify how much it was beautiful the rejection that we saw
32:50
Speaker A
from the value area low all this information can be paired with orderflow pattern to take precision trade. After this we have an acceptance and then we start to notice something interesting for two day they reject the top here and
33:07
Speaker A
they go lower in the P and the value area. So they don't have the value area matching but they go down. So they are starting to distribute. So what you can do is noticing and putting this as a
33:20
Speaker A
warning because you already rejected for today on the same level. This one could be a market shift. Okay. So you can put orange because you want to monitor this properly. The market tries to go back up again and fail. This stays still inside
33:34
Speaker A
the same area. So you can decide to merge these two profile and you can see that again the third day you have an amazing rejection. So the market is telling you that this is a strong wall and you have
33:48
Speaker A
a breakout of the previous value area low. So this day here is telling you look they are rejecting again when you exit from this whole area of balance you will have a trend and this is our confirmation day.
34:02
Speaker A
Look how much it was clear that they are continuing to push the low without accepting the high. You have a rejection an amazing rejection here that gives us a clear trend. And as you can see from here another test of the valuei amazing
34:18
Speaker A
short here. Another test of the value area amazing short here. Another test of the value area amazing short. And another test and an amazing short. After this, what we have? We have the market shifting the option. So from a down
34:32
Speaker A
profile, you go in an up profile. Is not a P shape. So it's still balance. You can use this as indecision. You can put blue instead of green. And then you have our P shape. Low volume on the downside,
34:44
Speaker A
completely absorbed. And we have a strong P. What can we expect that we will have the following days of strong trend up and we have 1 2 3 and four days of strong trend up. Notice also much is
34:57
Speaker A
precise the value area low as a rejection in the cash session. Also here after this you have a clear shift here you can see up and down and again from here you want to start noticing the rejection area. Okay? Okay. So you want
35:13
Speaker A
to start noticing the market joining the trend on the downside because you are going down with the auction. So you have one trade, you have down, you have all these rejection. You see they try to break the value area low. This two value
35:26
Speaker A
area low and all this was a fake out. They got rejected and the market goes back down after this shift. So this one is an indecision day. Okay.
35:36
Speaker A
Where the market changed the auction. Sorry, not an indecision day, a change of the auction here. And here you can see how they sustained this movement for three following days. After this they try to shift down they failed because
35:50
Speaker A
this one if you try a short would have been a stop loss. The first stop loss in all these days and they bring the auction up and this is a setup that we saw in the live community together. This
36:01
Speaker A
long. Okay. Also this long was a setup that we saw till the moment we shifted.
36:06
Speaker A
And when we shift, we start to see the rejection on the upside and the market collapsed. As you can see here, I took this short from here. Then it shift again and then you go down. Okay. So here if you try to short this value
36:21
Speaker A
area, you would have taken a stop loss. You have a shift again and these two trades would pay you out. But why the market when it reach this sensitive level is having a stronger rejection?
36:32
Speaker A
Because we are on the upper part of the distribution. So this one was completely predictable and this is the level that I gave to the community multiple times to try the long also this one this long was anticipated. I explained to them that
36:49
Speaker A
they will see a rejection from the 25,200 180 200 that will be really strong to go on the upside and this is exactly what happened again. Now we are going back to the fair value of the distribution. Now
37:03
Speaker A
that we saw all the logic related to the profile framing, we can go to the execution part and the order flow pattern. So we saw the absorption, we saw the exhaustion, we saw the initiative auction and for my first year
37:16
Speaker A
of orderflow trading, I was using the full profile footprint. Then after I became a scalper, so I have the necessity to visualize information in a fast and efficient way to take fast decision, I created this template. This is the deep trades view and is giving
37:34
Speaker A
you a filter on executed orders based on the size. So I only want to see big market participants. And in this case for example this was an area qualified for the short that you can qualified as I show you previously using the profile
37:50
Speaker A
using your technical analysis strategies using everything. What I watch is the interaction between my level and the market participants the big market participants. In this case here I can see that all these effort 72 61 60 62.
38:07
Speaker A
So a total of 300 contract on this horizontal level where also the aggressive sellers already show their strong aggression with result showing me that all this effort is being absorbed.
38:21
Speaker A
So this is a perfect example of absorption. This is a confirmation for me to start building my position on the downside. And the information for me that I can put my position at risk-free comes immediately 3 minutes after when
38:36
Speaker A
the market is telling me look that they are adding short position and the result of the candle is really strong. So I can capitalize on this movement. Here you can see what we saw in the example before. So an absorption midcand. So
38:51
Speaker A
buyers tried to enter aggressively here but got completely absorbed and the candle closed sell. Now let's go on the app example that I took on the long side on my account. That was a qualified area to search for longs and the market comes
39:06
Speaker A
back to this area the first time. It comes back and you can see 105 executed order on NASDAQ on this horizontal level on the week. So it means that these aggressive orders got rejected. They didn't add a result. They got completely
39:21
Speaker A
absorbed. The market tried again failed. The market tried again another time and the last time that he try it tried with 101 contract always on the same horizontal level. So let's do a summary.
39:34
Speaker A
You have a method of qualifying important areas that it can be volume profile, it can be VWAP, it can be anything you like to use supply and demand. And then you have an information from the execution point of view of the
39:47
Speaker A
market participants. And you can see here that also the buyers had an hard time having a result because they got completely absorbed. So now we are stuck here. You can do this ping pong till here and when you break this level, you
40:01
Speaker A
can decide to put your stop loss to break even. So if you decide to enter here like this with a target here, okay, you can decide to go from 1 to two to 1 to5 and put your stop loss to break
40:13
Speaker A
even. What happened yesterday was the following. So you have another attempt after breaking out of the sellers of breaking complete absorption and you have an amazing explosion on the upside where you can trail and this for example is my momentum model that you saw live
40:29
Speaker A
for 1,000 time. You can trail your position following the aggression of the market. So this one print a new one. You bring your stop loss here and you continue. Okay. And yesterday was an amazing move on the market was really
40:44
Speaker A
aggressive. And this is how I merge the information that I get from volume analysis, the information that I get from order flow analysis and the information that I get from result. So from price. So, if you enjoy this video,
40:57
Speaker A
you will find this full map on my Telegram. And don't forget to subscribe to the channel.
Topics:order flowtrading strategymarket orderslimit ordersprice actionfootprint chartliquidityinstitutional tradingvolume profileauction market theory

Frequently Asked Questions

What is order flow trading?

Order flow trading analyzes the real-time interaction between buyers and sellers by examining executed orders and liquidity, providing deeper insights than traditional price action.

How do market orders and limit orders differ in execution and price certainty?

Market orders guarantee execution but have price uncertainty as they fill at the best available price, while limit orders have price certainty but may not be executed if no matching orders exist.

Why is understanding liquidity important in order flow trading?

Liquidity determines how market orders are filled; insufficient liquidity causes price slippage, impacting trade execution and market movement, which order flow analysis helps to anticipate.

Get More with the Söz AI App

Transcribe recordings, audio files, and YouTube videos — with AI summaries, speaker detection, and unlimited transcriptions.

Or transcribe another YouTube video here →