Skip to content
Get App

PTG University 3 Day Cycle Part 1

PTG University lesson introducing the three-day cycle (tailor trading technique), a short-term framework tracing institutional price rhythms from George Taylor's grain-trading method. Part one of two.

Key Takeaways

  • The three-day cycle is a short-term framework for reading the choppy, rhythmic nature of markets driven by institutional flows.
  • Cycle day one is typically a buy day forming a secure low, day two a rally to a high, and day three a sell-short or decline day.
  • Violations of prior-day lows and highs signal whether institutions are accepting or rejecting price levels.
  • Historical probabilities cited in the lecture favor positive three-day cycles, but results are hypothetical and carry risk.

What the video covers

  • Lecture is Part 1 of a two-part PTG University series on the three-day cycle, module 15, dated March 23, 2016.
  • The three-day cycle, also called the Taylor trading technique, was developed by trader George Douglas Taylor in the 1940s-50s while trading grains.
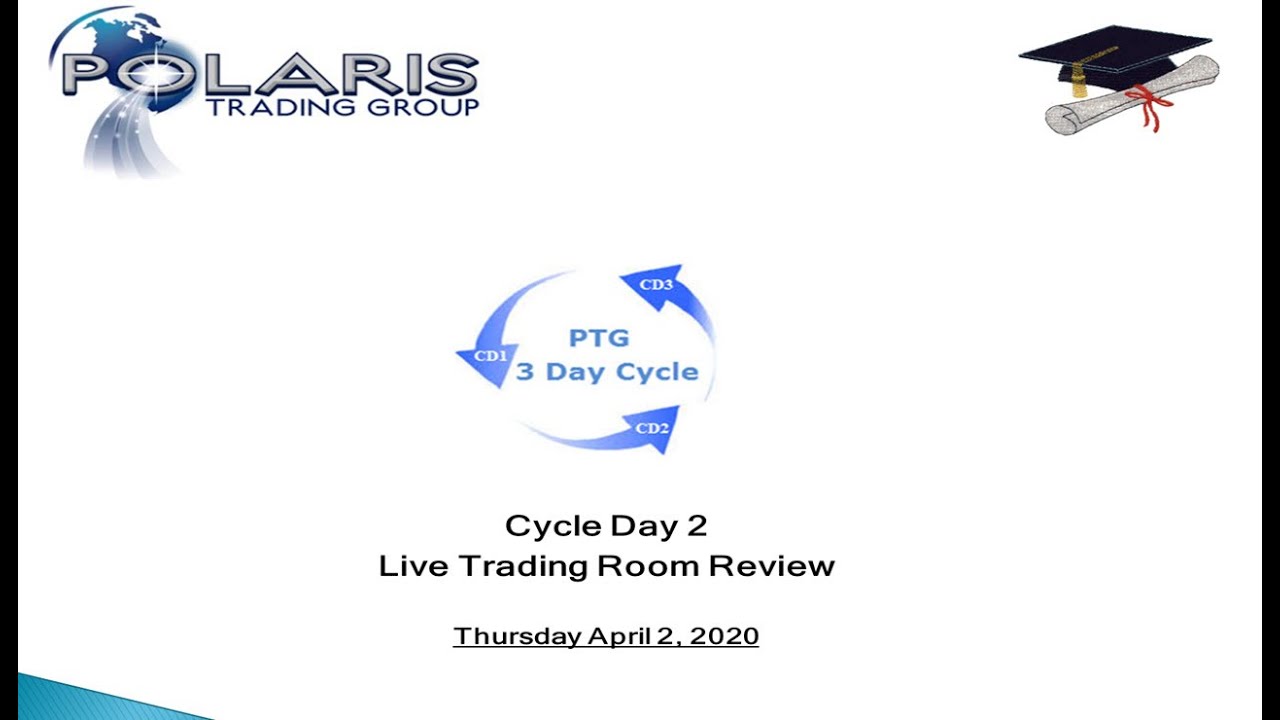
  • The cycle is structured as cycle day one (buy day, cycle low), cycle day two (sell day, rally to a cycle high), and cycle day three (sell-short day, decline back toward the next low).
  • Core premise: markets are driven by large institutional 'smart money', which tends to create rhythmic swings from extreme highs to extreme lows.
  • Markets have an inherent bullish bias, since mutual funds are primarily long-only, and markets trend only about 30-35% of the time, spending most time in balance or choppy ranges.
  • Key concepts include violation and penetration of prior-day highs and lows, and identifying secure lows before the rally to cycle day two high.
  • Projections of price ranges and highs/lows are calculated using a proprietary spreadsheet, which is covered in Part 2.
  • The presenter reviews a recent cycle as a practical example and cites roughly an 84% probability of a positive three-day cycle.
  • The lecture includes NFA compliance disclaimers that hypothetical results have limitations and that futures trading involves substantial risk of loss.

Answers

Questions about this video

What is the three-day cycle according to this lecture?

The three-day cycle is a short-term trading framework, also called the Taylor trading technique, that describes a repeating pattern of a cycle day one low, a cycle day two high, and a cycle day three decline. It was developed by George Douglas Taylor, who observed these rhythmic swings while trading grains in the 1940s and 1950s.

Who created the three-day cycle method?

The method was created by George Douglas Taylor, a trader active in the 1940s and early 1950s who traded primarily grains. He observed that prices oscillated rhythmically every three days and attributed this to the actions of large institutional investors.

What probability does the presenter cite for a positive three-day cycle?

The presenter states that historical probabilities favor about 84% of three-day cycles being positive. The lecture also stresses that hypothetical performance has inherent limitations and that futures trading involves substantial risk.

Full Transcript — Download SRT & Markdown

00:01
Speaker A
good afternoon everybody to the Polaris trading groups ptg University educational series today is March 23rd 2016 and we are on module 15 today's topic is going to be a long awaited request workshop regarding the three-day cycle this will be part one of a
00:25
Speaker A
two-part series the three-day cycle is also known as the tailor trading technique now this particular technique is a mainstay and it has been a mainstay of our methodology for quite some time it acts as a framework from which we
00:45
Speaker A
base our trade setups and the action of the overall market in general and you'll see it's actually a very accurate three day period with probabilities and projections of price ranges and highs and lows that come very close to being
01:09
Speaker A
fulfilled on a regular basis so before we get to the details industry regulations do require that we least highlight the NFA compliance rule 2 - 29 many of you are already familiar with this but simply that hypothetical performance results have many inherent
01:29
Speaker A
limitations and trading in futures and options and derivatives on futures are speculative in nature and involve substantial risk of loss iPass performance is not indicative of future results so on slide number one here this particular presentation is going to be
01:51
Speaker A
more conceptual so please bear with me we do have a number of charts but most of it is to get through the concepts of the three-day cycle and we'll get to the charts and examples throughout the presentation so a little bit about the
02:08
Speaker A
background and the core premise of the three-day cycle it was originally created by gentleman by the name of George Douglas Taylor he was a trader back in the 1940s and early 50s and he essentially traded I believe it was primarily the grains at the time
02:26
Speaker A
because we did not have the financial futures as we have today and he noticed that the prices tended to oscillate in a very rhythmic fashion every three days where the price would be pushed lower and then it would be it would bounce
02:50
Speaker A
back and then it would push higher all right and would go through the cyclic nature you know of you know highs and lows back and forth now the inherent nature of markets are bullish so that's one of the core premises that you need
03:11
Speaker A
to be you need to understand so today for instance if you take into consideration the mutual funds mutual funds invest long-only all right they're not short traders you have certainly hedge funds out there that do a lots of
03:29
Speaker A
short trading but they had but the mutual funds primarily are long only so they're bullish by Nature all right they go through their periods markets go through the periods of their markets I correct the phases right but generally
03:43
Speaker A
even in a bearish type cycle all right the markets do have and continue to exhibit a bullish tendency all right so the three day cycle is essentially a short-term method to read the inherent choppy of the markets that are experienced
04:01
Speaker A
again a lot of times the markets can just seemingly go back and forth oscillate without really any directional bias majority of the markets trend only about 3035 percent of the time and they're in balance type of range type
04:20
Speaker A
conditions or some people refer to them as choppy conditions but more actually a majority of the time but even though when they're in that type of condition there is generally a lien whether it's to the upside to the downside so think
04:35
Speaker A
of the markets going through a period of contraction and expansion contraction and expansion that's how I like to describe it to our members and there's a rhythmic fashion to it and so George Taylor back in the early 40s and 50s
04:52
Speaker A
trading the grains he saw that this it was more of a cyclic nature of price action and his basic view was that the markets were driven by the large institutional investor or ie the smart money he was a small guy all right small
05:11
Speaker A
contracts right he was you know trading with the big boys and you know he just understood that they really drove price action as they do today all right nothing has really changed from that core premise so the markets
05:26
Speaker A
today are still driven by the large institutional mutual fund hedge fund type money manager okay and traders and investors yes it is dominated today by high-frequency trading which is all computerized but even to that nature those algorithms and programs are driven
05:47
Speaker A
by still the large institutional investor okay so as a core premise to understand what this three day cycle is all about is is it's really the collective action of all that smart money all right and and again not
06:01
Speaker A
everybody is buying at the same time all right money managers are rebalancing their portfolios based on their own views of what the business and economic can additions are and market conditions are but simply the collective action of all
06:17
Speaker A
that all those decision makers in these large institutions simply drives the prices from extreme highs to extreme lows right and this this routes a repeated fashion and we see this every day all right you can just chart the
06:35
Speaker A
swing highs and swing lows and and again as you can see it's more cyclical in nature and it the basic core premise is is the three day cycle so the structure of the three day cycle is on cycle day
06:50
Speaker A
one it's also been referred to as a buy day now that's a little confusing all right but we'll get into the understanding of what that means that as a by day but I like to refer to them simply as cycle day one two and three
07:03
Speaker A
and as long as we understand the premise of each day then the the title that you give it I doesn't really matter but a cycle day one would be also considered to be a buy day cycle day two a sell day
07:20
Speaker A
in cycle day three a sell short day that was the original language that was used by George Taylor now the cycle pattern is simply generalized from a rally from the cycle day one low so as you as I
07:40
Speaker A
describe this take a look at the chart to the right hand side and I've put a graphic of this rally from the cycle day one low to the cycle day too high that is the once the cycle day low or
07:53
Speaker A
what we like to call a secure low is in place the market then proceeds to clear out all the remaining sellers and then rally rallied to a point where it creates a cycle day to high now how high that level is we have
08:15
Speaker A
projections that we can calculate and those are given on a spreadsheet the proprietary spreadsheet that we use and that'll be a discussion of part two of the three days cycle but for now just understand that once that cycle day one
08:37
Speaker A
low is found and it is found to be secure then that opens the door for the rally which pushes it up to cycle day to high and then at that point depending on if it's successfully met the projections
09:00
Speaker A
or not cycle day three could have continued strength or as we'll discuss a little bit later most recent couple days here if the market doesn't proceed to move higher then that's the beginning of a the next cycle decline so the end of
09:21
Speaker A
one cycle the beginning of a new cycle and the decline from cycle day three high down to the cycle day one low okay which today by the way is a cycle day one low so that's the basic setup of the
09:39
Speaker A
three day cycle so let's get a little bit more deeper into it and we'll discuss the concepts and assumptions of the three day cycle so these this is really important on understanding what's going on here so remember it's driven by
09:57
Speaker A
the smart money the big institutional players so the type of strategies that they run all right on the three day cycle is number one they want to force a violation of the previous day's low right so if you take into consideration
10:16
Speaker A
a high-low range okay every day we want to you know those are key markets for all traders and all traders should understand in what those levels are but they want to force a violation of a prior low now they may not always be
10:35
Speaker A
successful at that depending upon the supply demand that's going on at the time or the moment but the strategy is force a violation of the prior days low that creates a selling panic I and then buy it as low
10:51
Speaker A
as possible so for instance today is cycle day one the the goal of cycle day one is to find a new secure low so what happened today as an example today they forced a break of the prior low the
11:14
Speaker A
cycle day three low which grew on a gap which created a selling panic in a sense all right and they want to continue to push that as low as they can when I say they I mean the smart money the big
11:34
Speaker A
institutions force it as low as they can so they can buy it as cheaply as they can all right so that's the idea of a by day or cycle day one is to buy it as cheaply or as low as possible on the
11:49
Speaker A
flip side right as the cycle progresses upwards on cycle day two into cycle day three it's the force of penetration of the previous day high so a penetration means taking out a prior high in order to sell what they purchased the day
12:08
Speaker A
before on cycle day one simply at a higher price makes sense right then aren't always successful in doing that sometimes you know it takes some backing and filling on cycle day two in order to get that but the basic premise is that
12:25
Speaker A
there once they have that cycle day one low in place they want to then drive prices higher so they can sell them higher all right this is what this is what's all about and and again if you think about the collective action of
12:44
Speaker A
hedge funds the high-frequency firms as well as again the larger mutual funds I the idea is to is just that okay you want to buy it as cheaply as possible alright buy low sell high right it's a little cliche there but in essence right
13:03
Speaker A
there's a lot of fact to that and then once they're able to get price high enough if there is lack of any follow-through demand that and they recognize that there's no longer any real demand happening then that typically tips out the top part of the
13:24
Speaker A
cycle and again we have projections and and probabilities of those levels being achieved and if they are failed to achieve then the cycle pretty much completes and then the new cycle begins and as we saw today cycle day one I was
13:43
Speaker A
was a normal decline day of which happened today and we're gonna get into that in the next slide or two so simply the basic concept an assumption for the three day cycle is that the end of the cycle off is the greatest amount of
13:58
Speaker A
opportunity alright so at the at the end of a cycle they low or a cycle day high on cycle 2 or cycle 3 alright that's where the greatest amount of opportunities in other words the risk/reward ratios I am most favorable
14:17
Speaker A
and the large institutional player ie smart money looks to position themselves remember they're not day traders they're you know they're longer-term and their swing trading and so forth so they work to position themselves in a way now again are they always correct as it
14:37
Speaker A
always perfect of course not nobody is all right so then the last part of the concept and assumptions is the excess extremes mark the end of one cycle in the beginning of the next so we talk about prices being at extremes not so
14:55
Speaker A
much overbought and oversold but we refer to them as extremes and again we have ways of identifying those extremes okay so on the next slide let's move on we want to talk about the concepts of violation and penetration and these are
15:14
Speaker A
two terms that I use quite often in the trading room and these are this is the vernacular that is used by professionals out there alright so understanding violation and penetration simply when the market has a tendency to exceed the previous day's
15:29
Speaker A
higher low alright there's some residual momentum from the previous day into the next day right so that essentially results in what's called a violation of penetration of the previous day's higher low so for instance a violation simply is a break of the prior day's low or an
15:49
Speaker A
expansion of the range to the downside a penetration is a penetration of the prior day's high for an expansion to the upside so understanding those two terms are important when we discussed the three day cycle and again I use these
16:04
Speaker A
terms quite a bit now but though sometimes the residual motion momentum will be very strong and carry you know it can carry price far beyond the highs and the lows of the previous day now when that happens we have projections of
16:22
Speaker A
how far prices may carry on a specific day cycle day one two and three and it's based upon a large data set of historical observation all right and there now also other times what happens is price will reach and trade very near
16:42
Speaker A
to the prior days high or low find support or resistance not expand through it and then retreat or reverse back into the range so it we're not talking about predictions of what's going to happen with the cycle all right this is not a
17:00
Speaker A
predictive type right but it is it forms structure of how the cycles so we're always dealing as traders and probabilities so what's the probability of prices expanding outside the prior days range do we know that if price is
17:19
Speaker A
within the context of the range right do we know I mean for with with any real assurance that the price is going to expand higher or lower while we're still in the context of the prior days range no prices need to somebody has to
17:33
Speaker A
initiate trade outside of the prior days range to try to expand that range all right they may be successful they certainly may not be successful all right but if they are successful then we have ways of measuring to what degree or
17:50
Speaker A
extent they're able to push it all right extend the range and again we have projections and probabilities based upon that so let's just say if the market closes low in its range so here's another part of the concept that I want
18:07
Speaker A
everybody to understand when I discuss the high-low those are the parameters of the three major points of the day similar to a comp compass is the high low and mid point of a range all right those three points just like north south
18:29
Speaker A
east and west high-low midpoint then within that there's a upper 25% quartile and then there's a lower 25% quartile so that splits the entire day if you can visually in your mind that it's divided up into fourths or quartiles all right
18:49
Speaker A
so the idea that's important and the reason for that is if the markets closing low in its daily range so the lower 25% quartile all right the low of that day becomes a key reference point for the next day all
19:04
Speaker A
right so those highs and lows are always going to be key reference points if the markets closes high in its range right for the next session that's gonna be the key reference point all right and the closer it can close to the high and low
19:21
Speaker A
of the range the more important that particular level for the day is going into the next day all right it should be a pretty straightforward concept there but many times it's overlooked so I mean this is an important part of of what we're talking
19:40
Speaker A
about whether or not the highs and lows get violated or penetrated so simply in general a move that violates or penetrates the day's reference points or what's every day what's the day's reference point you have two of them all
19:53
Speaker A
right high and low all right so we can either be accepted or it can be rejected and we again we use those terms and many of you that are familiar with market profile or volume profiling you also are
20:06
Speaker A
familiar with the concept of it being accepted or rejected so we don't know whether it's going to be accepted or rejected that's why we use our Eau de loop right decision technique to identify whether or not and make some
20:21
Speaker A
assumptions and some by reading the market yeah this level is getting accepted or you know it's being rejected so we saw today that the opening range of rotation they tried to move it up you know they meaning the big boys tried to
20:34
Speaker A
move it up above that level a few times and every each and every time got rejected so that tells us something about the quality of the trade action that's unfolding at that at that price boat and the ultimate intention of the
20:50
Speaker A
market you know players collectively all right so again just as the last note here if price is rejected in violating and penetrating the reference point below of the high you have a reversal so where you Jackson is a reversal and that
21:08
Speaker A
becomes an eighth opportunity that's what we're looking for is price accepted will it break out if it doesn't and reverses is there an opportunity yes that becomes an opportunity and that's where the smart money begins to take action all right for the next
21:25
Speaker A
directional cycle move all right all right so let's get into the individual cycle days and we'll run through these you know fairly robustly all right but what's the main task for the for the cycle day one all right so this is the
21:43
Speaker A
first day of a cycle it simply to probe for a secure cycle low from which to stage the next rally now over time over these past months this is something that I continue to drill in on a day-to-day basis in the daily trade
22:01
Speaker A
strategy the daily trade strategies is written in a way where it brings in the concepts of the three day cycle and during the session in the trading room many times I'm always reinforcing the fact that prices being probed for a low
22:18
Speaker A
so in a sense on cycle day one the the norm is that there's a decline to probe for that new low where that new low is ultimately going to be placed again rather than predicting we have some projections of potential but ultimately
22:39
Speaker A
the market is the final arbiter of where it decides you know where that low is going to be all right so the main principle is simply that again we're looking for a decline from that cycle day three high at the end of the prior
22:54
Speaker A
cycle right down to whichever final secured low is in place on the cycle day two right and and there's an average decline value that is calculated based upon a long-term historical average range that has been observed from the
23:18
Speaker A
cycle day three down to the cycle day two and again that will be all the subject of the spreadsheet the proprietary spreadsheet that everybody will have access to all right after our presentations now going forward all right I highlight these levels in our
23:38
Speaker A
daily trade strategy again it's a core part of what I try to convey on a day to day basis of how we're setting up what we're looking for for the day what's the expectation or the inference or assumptions for the day okay so
23:55
Speaker A
throughout the course of cycle day one bounces within the context of the day are used as short-selling and I think we saw most of that today since today was cycle day one in in this current cycle we saw the bounces today failing to
24:14
Speaker A
carry above that opening range and aggressive trade is out there and money manages and so forth that employ the three day cycle again not every manager out there in the world does so but for those that do they use
24:31
Speaker A
the bounces as a day and as a way of selling short alright so selling short may be considered until that final lows in place but once once that lows it reached okay people close out their positions those that are feel confident that a
24:50
Speaker A
secure low is in place right now again once a low is in place on cycle day one it does not necessarily mean that that is the final secure low but it is the low on cycle day one as a matter of fact
25:05
Speaker A
today it was a textbook cycle day one and we hit the projected range low right to the tick of 20 handles so today's low at 20-25 spot 25 currently is is the new cycle day one low and whether or not
25:25
Speaker A
that becomes the final secure low I we won't know until tomorrow but the idea simply is if the if the large institutional smart money type players feel confident about that that's a secure low they're gonna use this opportunity throughout the debt today
25:46
Speaker A
and perhaps even into cycle day to tomorrow to continue to buy at those levels alright and to clean up whatever sellers that may be around alright so there are many ways to enter but again if you're a swing trader alright we on
26:03
Speaker A
the other hand are not swing trade as we are intraday traders but we want to stay in alignment with what this cycle offers and understanding what's going with the larger institution so we can position ourselves in a way to ride you
26:19
Speaker A
know the action along with them that's what we want to try to do is as I'm always trying to stay in alignment with the larger institutional player okay so here's a graphic of what I just discussed so maybe it'd be a little
26:33
Speaker A
easier for us to to read that so this just follow the little bubbles here is on number one right so again the decline begins from cycle day three so at the end of the prior cycle right SmartMoney decides that there's the buyers have
26:52
Speaker A
dried up there's there's no more interest at that particular level okay it's time to sell whatever final Long's that we may have and let's establish a short position so that's what happens on cycle day three once the buyers are
27:12
Speaker A
fulfilled from prior cycle and then as this is occurring this creates selling pressure throughout the course of the day and what we saw yesterday was lack of follow-through at the highs there was a but I think it would turned out to be
27:34
Speaker A
like a little mini triple high yesterday and we had a market on close selling balance of close to two billion dollars cash equities so does that mean everybody is selling them on you know short at that market on clothes no of
27:51
Speaker A
course not but the fact that prices could not move higher during the cycle day three trading session right begins to create that selling pressure via long selling or new short selling alright for the cycle now today coming into cycle
28:18
Speaker A
day two so once the cycle day - excuse me once on Bubble number two once the cycle day three was violated so using that term violation to force a violation to force long liquidation so what does that mean
28:34
Speaker A
if on the lowest cycle day 3 lo is violated everybody that bought yesterday or the day before they're trapped so with what the idea is now is entering on cycle day 1 as you can see the labels here CD 1 CD 3 CD 1 CD 2 is 4 so for
28:59
Speaker A
solo violation of CD 3 forcing Long's to take to liquidate the shorts that establish themselves on cycle day 3 are in the money and they will continue to press as they actually did today on cycle day 1 alright until they reach
29:23
Speaker A
some average range level alright so there's a there's usually a projected the average decline from cycle day 3 down to cycle day 1 alright and again again this is helps to create a stencil for a cycle low alright so short
29:39
Speaker A
positions as I said as the the lows are being made alright those that are short from you know the day prior or earlier in the current you know cycle day 1 session again they begin to cover their positions right they may not cover them
29:54
Speaker A
all but they probably cover most of them alright and that that kind of completes a short cycle for those that took initiated shorts off of that CD 3 or cycle day 3 now the larger big money are institutions which are typically long
30:15
Speaker A
only alright they're really looking you know they're not looking to sell short like we just described but rather they're looking to use cycle day one understanding the nature of the of the cycles where there's an expansion and contraction
30:29
Speaker A
alright so in this case they pull back within the context of the larger picture offers them an opportunity to buy right on the pullback bye on a weakness alright remember the big institutional money managers that they're not day
30:49
Speaker A
trading maybe some of them are but majority of them their mutual funds they again their long lonely so they want to reposition their portfolios maybe they have a number of you know stocks that are on their buy lists all right they
31:03
Speaker A
use this as an opportunity weakness on days like cycle day one to establish new positions all right so again think about this is the collective action of everybody all right not just one individual you know mutual fund or
31:19
Speaker A
anything like that so once this low is finally put in and the sellers are flushed out I the beginning of the new cycle back to the upside begins and that leads us into cycle day 2 which for us
31:34
Speaker A
then would be tomorrow so on the next graphic we'll take a look at cycle day 2 here in action so again just recall this is just a continuation of the same chart and at bubble 1 this is where the
31:50
Speaker A
sellers concluded and the buyers had stepped in as we just discussed as mutual funds and so forth all right and then they begin to move price back up cleaning out whatever residual sellers that there may be left over but any
32:08
Speaker A
residual sellers more likely or not strong and the rally now can continue now again the rally from the cycle day 1 low that's secured low to whatever the potential high is for the cycle day to high right can we have historical
32:28
Speaker A
projections does not always reach those projections but it gives us a guide of what the potential is and then as the day unfolds right we look to see how the market is reacting relative to you know the projected potential for the day
32:48
Speaker A
alright so the markets always have a level of potential on a day to day basis okay all right so so if you think about it so you know as smart money you know having established long positions out of
33:09
Speaker A
near the cycle day one low all right so now this allows the new cycle you know to proceed until that projected average we have what's called an average range high so we spoke of an average decline we have an average range or what we
33:24
Speaker A
simply talk about is cycle day three target all right so until that potential is reached ie on that cycle day too high right opposite to what we just discussed on cycle day one Long's can be considered so if
33:42
Speaker A
there's a pullback in price on cycle day two that does not violate the cycle day one low meaning that there's a secure low right open Long's can be considered so buying that pullback within the context of that the cycle high or
34:03
Speaker A
projection has not been reached yet so the big institutions want to continue to buy that and in again the selling that more than likely occurs on cycle day two is residual selling usually not initiative you know type selling okay so
34:24
Speaker A
again the idea is to try to close the cycle day two as high as possible i again not always the case but that's that that's the you know goal alright so Steve asked if cycle day two makes a
34:42
Speaker A
lower low and/or a lower high alright does that influence how much of the cycle day two might rally it may you know if again there are times where cycle day two is still part of a decline that the secure low or the low of the
35:04
Speaker A
cycle may or may not be 100% in place so given that we you know the cycle day one creates a low we're not sure a hundred percent whether that cycle day one is the final low it could actually occur on cycle day
35:21
Speaker A
two and when that does you know we actually have that there's odds of a rally back above the cycle day one low and we'll discuss the idea of what constitutes a positive three day cycle all right but there will there could be
35:40
Speaker A
certainly cases with you know that will be the case where on cycle day two we still have a series of lower lows and lower highs all right that will influence how much of our you know projection that price can rally cuz it
35:53
Speaker A
may take a couple days before it finally gets to rally all right probability-wise the three day cycle has very good odds up to the eighty four percent of a positive three day cycle alright and again we'll discuss that on an upcoming
36:14
Speaker A
slide what constitutes the cycle but that's a great question and again there are always variations so what I'm giving you here everybody is you know this is the template alright this is the ideal cycle and at times we do get an ideal
36:32
Speaker A
cycle there are other times where the cycle there are variants right of the cycle yeah a day doesn't unfold as normal so we would call a day an aberrant day all right but that doesn't mean the cycle is
36:49
Speaker A
broken any cycles sometimes can extend right holidays can affect the cycle somewhat all right things like that nature but certainly news events I you know external things going on yo geopolitical happenings around the world certainly can affect the cycle alright
37:11
Speaker A
but as with any cycle if it gets disrupted it generally will kind of you know it's like a kayak you know you you you flip a chi you know more likely you know it'll write itself back up alright so the
37:26
Speaker A
cycle tends to at times get bumped I and it may not you know be this perfect cycle that that we're describing today but it does you know eventually write itself and and during those periods there's ways of identifying in the ways
37:42
Speaker A
of making adjustments to it and again that's more about the education overall so this particular presentation is focused primarily on you know the the core part of on the concepts you know of the cycle itself alright okay good good
37:59
Speaker A
question all right so now this leads us into the final part of the cycle of cycle day three all right and there are you know two conditions right so if price closes on cycle day two in the high part of the range right that high
38:21
Speaker A
of the day whatever that may be it becomes the key reference price if prices then can rally or extend the on cycle day choose high then we come we have an extension or potentially an expansion of the cycle alright and again
38:43
Speaker A
we have projected levels alright so what we're looking for on a day to day basis is we're looking for that acceptance or rejection of those cycle of the reign range highs or lows for the day alright and if you've never thought about it
39:01
Speaker A
this way this is kind of a natural way of understand is doing the auction and the simply we're trying to you know understand is is it being accepted those are being rejected I you know if it's being accepted what does that mean for
39:19
Speaker A
me is there an opportunity you know maybe I should be paying higher prices now simply because price is being accepted how do we know it's being accepted right and again to bring in a market profile concept is time and price
39:35
Speaker A
I volume and time and price so for instance the longer price stays you know at a location the greater number and in the greater volume that's created in there during that time period okay that particular price point or a level or
39:52
Speaker A
zone is more likely to be viewed as being accepted so even if it is at a higher price if it's being accepted that means is more likely to have continued higher price action coming vice versa or if price is sitting on lows and it's not
40:10
Speaker A
being reversed okay that level is more likely being accepted so we're looking for that failure or rejection I constantly so in this example here right it shows that on cycle day 3 the beginning of cycle day 3 could not in
40:32
Speaker A
where it's pointing on bubble 1 prices could not penetrate cycle days too high so what does that tell or indicate to the smart money out there well if on cycle day 2 prices are at or near highs what's what is these what is the smart
40:55
Speaker A
money more likely doing on cycle day 2 especially if they're able to push it to levels where you know projected ranges are they're more likely paring back their position selling it to those buyers that are coming into the markets
41:13
Speaker A
late alright there's always going to be a late buyer or a late seller out there right so they're gonna be selling into those into that potential final demand that's being created well we don't know that's final demand on cycle day 2 until
41:28
Speaker A
we start seeing what happens on the next day does price continue above cycle day too high it does it get rejected that will give us an idea of whether or not those late comer buyers in a case like
41:41
Speaker A
this would be trapped like we saw today from yesterday alright so in this example as you see on the slide this is a case where buyers were not able to expand price bill beyond cycle day too high and as a result that
42:02
Speaker A
indicates to the smarter money people all right that you know I I better start getting rid of the rest of my holdings contracts individual stocks by the way this does this particular cycle concept works for individual stocks it works for
42:21
Speaker A
all various instruments all right it's not just for grains or for the S&P 500 but it is universal concept that applies to actually individual stocks as well so think of it from that standpoint that it's it's a it's a strategy trading
42:41
Speaker A
strategy that applies universally alright so what happens then on alright well okay so how do you define a fourth violation good question we're coming right into that so a fourth violation is a push below the prior day's low so in
43:01
Speaker A
this case on the slide here on the left side of the slide that's cycle day two right so price pushed up to let's just call it a projected high target we can see there that magenta zone is the
43:13
Speaker A
three-day central pivot zone tends to be a target of level for us in on many days so a forced violation is failure to move above the prior day's high which is the cycle day to high can't get through that
43:29
Speaker A
let's go sell them alright and they push it down to the cycle day twos low now what is anticipated at the prior day's low well if the buyers held it there yesterday the anticipation or inference would be that that low would probably
43:52
Speaker A
elicit responsive buyers that bought them yesterday but if the supply today cycle day three is greater and the buyers the bottom yesterday our late comer buyers if you will they're more likely not going to be the strong group and a forced violation with me it
44:16
Speaker A
would mean a breakthrough the prior days low cycle day to slow and that creates anxiety on the on the part of the buyers that bottom the day before and they may be forced to say I'm selling them to so
44:35
Speaker A
that just creates more selling and it's essentially a forced liquidation scenario okay does that make sense okay so good we're on time here so this is the final part of the three day cycle and we're again will review that in a
44:56
Speaker A
moment of everything but let's on the next slide we'll look at will discuss some final comments about the cycle and observations so first off we know that the three day cycle begins from cycle day three hi - the cycle day one low
45:20
Speaker A
that's the range that is the initial starting point of the calculation so once we they have established a cycle three high right that distance from that high down to whatever the final cd1 low is that constitutes a range all right so
45:37
Speaker A
it's not the range of the cycle day one high or low but the range from the cycle day three high down to the cycle day one so it's it's a two day range in a sense okay so what our current statistics show
45:53
Speaker A
over a long period of time on most instruments there's an 84 percent probability of a positive three day cycle even though I even you know with we have bear markets alright so why is that why is that there's 84 percent odds
46:12
Speaker A
of a three day cycle remember what I said earlier the large mutual funds are long only yes they do sell but they have so much buying power that even on dips in the market they tend to absorb that selling and push it back up
46:33
Speaker A
because it's in their best interest to do so all right so but we go through these periods where you know we got kind of this bearish action and we got you know but even in the bearish action you know
46:46
Speaker A
people will be calling for a bear market but in essence it's just the pullback sellers get absorbed and then they push it back up so what constitutes a three-day rally all right now you may need to review this presentation a few
47:05
Speaker A
times because it's not necessarily an intuitive concept but the more you do work with it and since I comment on it daily in the daily trade strategy all right it will become clearer alright the more you work with it right this is not
47:26
Speaker A
a one-off workshop a workshop is just that you know you take your block of wood you take your your sander you take your plane you take you your nails you take whatever you need to you take this block of wood all right and you work
47:42
Speaker A
with it if you take the block wood and just put it onto the side and say yeah okay yeah we had a workshop on that particular you know and never work with it again then you're gonna disadvantage yourself alright so if on cycle day two
47:58
Speaker A
price closes on the high we should expect the tests of these highs and shorts can be considered upon failure or rejection of such a test in other words we just saw the slide I let me just cook go back to this slide right here alright
48:26
Speaker A
so on cycle day two we got to put put in high so if coming into cycle day three there's usually going to be a test of that hi if that test fails okay then that's what's considered a rejection all
48:41
Speaker A
right okay so now if price closed on the low of CD two cycle day two and that low is still above cycle day one's low at the open of cycle day three now again we'll take a look at a chart here a live
49:06
Speaker A
chart from the past couple days and we'll see that again just walk through that a second with me all right so if the close if price closes on the low of cycle day two but that low is still
49:17
Speaker A
above cycle day one's low at the open of cycle day three all right then it's a positive three day cycle all right and then lastly if the open of cycle day three is below cycle day one's low remember that cycle day one as low as
49:43
Speaker A
the secure low if it's opens below that all right then that means we don't have a positive three day cycle but we do typically have high odds on that day cycle day three to come back above the cycle day one low
50:04
Speaker A
which then it would produce a positive three day cycle it can be a little confusing all right that's why I want to you know step with it and again you're going to definitely need to review this all right
50:19
Speaker A
multiple times right guys I've been using the three day cycle for over twenty years I learned about it many many many moons ago and it's become a mainstay in how I do business how I trade what I look for it
50:49
Speaker A
forms a template okay and nothing is perfect out there but the beauty of is it is it's flexible and it keeps you in alignment you hear me talk about this all the time is that you know one of my
51:02
Speaker A
core missions is to keep all our members in alignment with the larger institutional community that's my background that's where I want to keep you focused with all right if you're gonna be trading in the same waters as the large sharks in the killer whales
51:22
Speaker A
well we better be on the correct side of you know along with them right I don't want to be bait I don't want to be their food source I want to be along going along with them so the 3-day cycle
51:35
Speaker A
pattern is has been around for years 1940s 1950s a lot of people are not familiar with the three day cycle simply because they've perhaps never came across it they were never taught it alright um a lot of professional money
51:52
Speaker A
managers hedge funds know about the three day cycle and they've been utilizing it for years look it may not be something that they want to you know readily present to the public because it's been working so well for them
52:06
Speaker A
they're considered the smart money right they manage trillions of dollars worldwide so if you have you know this group that understands how this cycle works all right some people you know we call it the three day cycle here that's
52:25
Speaker A
what George Taylor referenced it as some people use like a two and a half day to four day cycle well that's essentially a three day cycle depending on how you want to adjust others out there use a five or a seven day cycle alright
52:47
Speaker A
whichever they want to use that's fine this particular one has stood the test of time over and over again it's it it's once you get the concepts down it's fairly easy to understand all right but the beauty of it it's we're
53:02
Speaker A
reading the collective action of all these smart money guys buying and selling all right we have an understanding of how they act all right how they exhale where they're expected to act okay so if we have an idea of how they're expected
53:19
Speaker A
to act collectively we can make an observation using our Eau de loop technique right our Eau de loop technique that we have in in a prior workshop observation orientation decision action so if we can use that technique to observe have an
53:35
Speaker A
understanding of what we're expecting to see well we can then make a judgment of whether or not that's actually happening or not all right so that's important in understanding and being mindful of the price action you know at these key reference price levels
53:53
Speaker A
highs and lows okay you know these violations and these penetrations okay Friday is a holiday this week in cd3 so we'll be Monday and CD 1 even though Friday is no trade correct so today is CD 1 which is Wednesday Thursday cycle
54:13
Speaker A
day 2 Monday will be cycle day 3 yes all right all right so now I - you know in kind of a final conclusion here all right so we as individual investors you know slash traders right day trading
54:29
Speaker A
out there I try to make a living I we have a very important armament here right and the armament simply is the knowledge now that we can evaluate what the smart money status is doing all right we can trade and beyond
54:49
Speaker A
you know trading alongside them as opposed to being you know in front of them alright I'd rather be you know you did you know I don't want to be the last to know all right and again we talked about two
55:04
Speaker A
groups that I identify in form traders uninformed traders so do you want to be of the informed group or the uninformed group okay again this is something that I've used for many many years and it's kept me whole
55:19
Speaker A
you know longevity is is you know really important in this business and we spoke about you know survivability in learning survival skills I in trading especially the futures markets you need to have the proper equipment to work with and that
55:40
Speaker A
equipment is knowledge all right and again so now as far as I'm concerned everybody this rounds out the core of what Polaris trading groups methodology is all about in Prior videos and workshops we've gone through various components but this truly rounds out
56:03
Speaker A
what what I'm all about what we look for okay so you know I consider all our members here at Polaris as part of the informed elite group of traders or investors not the uninformed but we are part of the informed group all right so
56:20
Speaker A
that's important yeah cd3 this cycle will be Monday Monday so today a cycle day one Wednesday cycle day two Thursday Friday's off all right and I believe I I'll know for sure because I'm not sure if it's if it's a short session in
56:50
Speaker A
futures or not on Friday but I know the cash session of course is closed so that's going to push cycle day three all right there is no futures okay so then that will push cycle day three to Monday
57:05
Speaker A
all right well it doesn't the holiday doesn't skip a cycle it pushes it pushes it it's not a calendar cycle if you think about that Steve so I think what you're asking is it a calendar day cycle it's not a calendar day cycle it's a
57:20
Speaker A
trading day cycle all right is it possible to post cycle day highs and lows at the end of every trading day all it is been is the day's high in the low okay well I'm gonna show you a let me let me just finish up here
57:41
Speaker A
all right and let me just show you a couple things okay so let me bring in a chart here okay so what you're seeing on the screen here is the three day cycle on a 60-minute chart so for brevity and
58:02
Speaker A
so forth this is the chart that I use that I create every day for the daily trade strategy and I've taken all the extraneous information out of it and I've just focused on the cycle day's levels now what I simply do here is I
58:19
Speaker A
post by the way this is done manually this particular chart alright and I think it's important sometimes to do things manually because the more you do things manually you can get a sense of you know what's going on if you're just
58:37
Speaker A
if you have the computer calculate every level and high and low and and so forth and you just stare at it you're not really being engaged with it so it's important that you engage yourself with your charts so the this brings us to two
58:56
Speaker A
today all right so this is today's action on cycle day one all right but let's just walk through this cycle which was most recent so instead of you know talking theory all right we'll actually talk to practicality of what happened
59:10
Speaker A
over the past several days alright so in the past several days let's just start with the cycle day three high over here now this was the conclusion of a prior high right so again this was cycle day twos high right and on cycle day three
59:30
Speaker A
this column here right they pushed it down there was a rejection here initially and then they rallied it up strong and they closed the cycle day three high and I believe this met projections for that particular cycle so once these
59:48
Speaker A
projections were met the cycle day three targets are the cycle high targets going into begins a new cycle now so from cycle day three the expectation is a pullback in to cycle day one to find a new secure low now momentum has a lot to
60:09
Speaker A
do with how deep a pullback goes so if you can visualize here it should be fairly simple on this cycle day three there was a lot of momentum to the upside alright that momentum does not reverse that easily so on cycle day
60:28
Speaker A
three down to the cycle day one or low okay it was a shallow retracement all right I don't even think it met the average decline observed on cycle day one so it created a higher low took out the prior high here and that became the
60:52
Speaker A
new secure low alright and then on cycle day one it started to rally alright so you got the rally on cycle day one so remember though if you take a look at today cycle day one here to the right well that's this is a
61:11
Speaker A
normal actually cycle day one right we had expected a decline we got a full decline the cycle day one over here we expect a decline but it was shorter than the average decline that would be experienced on cycle day one what does
61:31
Speaker A
that mean means that this is a powerful cycle here and we should be expecting even higher prices to continue so what happens a low shallow is put in place right a shallow low early prices rally that day on cycle day one
61:49
Speaker A
and it rally on cycle day one sure can right now into cycle day two what happens all right a backing and filling somewhat a little bit of a pullback very similar pullback to the to the prior day makes a higher low so on cycle day two
62:08
Speaker A
there's a lot of backing and filling all right that in a sense takes place all right sometimes it tests the prior low sometimes it creates a higher low all right we don't know exactly but we I have an understanding of what may
62:26
Speaker A
develop and that's why we're actively you know assessing what's happening throughout the day all right remember this is not a cookie cutter this is a template of how the cycle typically unfolds right but there will be variance at all times of what the
62:46
Speaker A
cycle norm it will do so that you're gonna get it remain you know flexible in this but understand these cycles and again like I said the more you work with them the more you they will become understandable all right so what happens
63:03
Speaker A
on cycle day two and what do we expect in cycle day two will you expect that prices should close at or near the high part of the session that's the expectation that's the norm what happens on cycle day two here after early
63:17
Speaker A
correction prices close at or near the high point of the cycle all right on cycle day two now I'm not sure whether or not this met projections or not but it did exactly what it was expected to do early in cycle day three session fail
63:39
Speaker A
you to move above the cycle day to high what does that create that creates a failure right to push above the cycle day to high right so right in here this creates a failure what's the expectation if it can't get through the cycle day
63:58
Speaker A
too high alright a pullback or sell down all right now every cycle day three or two can it can have their variance all right so what happened here they pushed it down early there was some news overnight I believe this happened
64:15
Speaker A
to do with some of the Brussels bombings if I believe right so that disrupted the norm the norm here would have been on cycle day three open higher above the cycle day too high that would be the norm but as I mentioned geopolitical
64:41
Speaker A
events external of you know terrorist events all right such as what happened guess what it disrupted the norm but what happened just like a kayak I gave you guys the example earlier of the kayak right if you turn the kayak upside
65:00
Speaker A
down and you're in it right what do you do you can roll back up very easily up right so this is what happened all right here on cycle day three they pushed it down all right well the kayak rolled
65:13
Speaker A
right back up and cycle day three did exactly what it was truly expected to do clear the cycle day two highs reach cycle targets sellout Long's from earlier price levels and perhaps begin to establish short positions for the
65:36
Speaker A
next cycle we saw yesterday on this particular cycle day three they had trouble getting through the twenty forty seven s and we closed with a two billion dollar equity market on close sell imbalance in the overnight what what did
65:54
Speaker A
they do here they tried to do what they tried to get back above the prior cycles hi look at today's cycles high here right about equivalent to cycle day two and failure to get above yesterday's cycle day three hike
66:13
Speaker A
guess what that sets up a decline coming into cycle day one what's the normal cycle action they move from cycle day three hi down to cycle day one low that would be the norm did the norm unfold today
66:33
Speaker A
certainly did okay so that's the cycle in action and this was actually a very good cycle example here all right so now we closed in the low part of the range today cycle day one we hit the actual
66:51
Speaker A
low of day range projection that we had laid out in our daily trade strategy by the way to the tick all right that was nice to see tomorrow cycle day two well prices closed low in its range so what
67:09
Speaker A
becomes the new cycle day one there you can see here cycle day one low Globex at twenty twenty seven that was the prior cycle over here to the left so the twenty twenty-five twenty-five s becomes the new cycle day one key reference
67:26
Speaker A
price what happens tomorrow well we're going to need to find out what happens in the overnight Globex do they continue the sell down do they hold the lows here today what's going to happen during the cast session tomorrow we'll evaluate
67:46
Speaker A
when tomorrow comes so what we do know though is once they do find a secure low now whether today's low is secure or not we'll we'll know better tomorrow but the expectation is once there is a secure low cleaning out all the sellers the
68:05
Speaker A
expectation would be for a rally to begin on cycle day two and then there will be projections on how far that rally can take it based upon what the secure cycle low is today's low may or may not be the secure low they may push
68:22
Speaker A
it a little bit low or find a lower point from which to have the cycle a low point all right and again whether or not the it's a positive three day cycle on this next one coming into the weekend and
68:37
Speaker A
Monday will be how to how tomorrow closes and then how it opens on Monday whether it's above or below cycle day ones low cycle day one's low is always a reference of the of whether the cycle is a positive cycle or a negative cycle
68:56
Speaker A
alright and again the probabilities favor 84% having a positive three day cycle so that's pretty good odds alright so I'm gonna make one final slide here I want to preview going into part two of the three day cycle so give me a moment
69:18
Speaker A
to change the slide okay so when this particular slide what I want to do is preview you on part two and this is what we're gonna discuss is the ptg TTT which stands for a Taylor trading technique eBook now again as I mentioned at the
69:37
Speaker A
beginning of the presentation the Taylor trading technique was demented by George Taylor alright and it was a short-term trading technique alright and again essentially we discussed about the three day cycle and being manipulated and driven by the smart money now what he
69:53
Speaker A
did is he used what he referred to as a book method so he technically back then back in the 40s and 50s he had a little you know notebook of sorts when he was in the pits and he he basically logged
70:07
Speaker A
you know what the highs of the day is the lows of the days what key reference points were etc etc and and again he always he measured out when the markets exceeded those highs he made to know how
70:21
Speaker A
far did it exceed on cycle day one how far did it exceed on cycle day two if it did alright how many occurrences happened etc and he was very it was very laborious but he was very detailed about
70:37
Speaker A
his work and and he did it in what's called what he would refer to as a book method all right and so again this understand his core premise that the markets manipulated in stages over repeated days over and over so this three day cycle
70:52
Speaker A
repetitive process all right he was able to identify that on certain days prices were able to move an average an average range above the prior high or low all right again think about you know logging these things day in and day out there's a lot
71:16
Speaker A
of work doing it by hand alright so that was that in the 1950s and you know again he you know kind of eyeballed things and you know it was it was pretty you know it's pretty accurate and he actually
71:27
Speaker A
became a very successful trader understanding that you know these cycles and the ranges that they produced so he was able to identify when the probabilities favored as I said key reversal points at these extremes where the markets are more likely ready to
71:44
Speaker A
reverse and then he would able he was able to position himself I alongside those so-called smart money bigger institutional type players all right so that was what he did pretty insightful of the day all right now what we've done is I've teamed up
72:03
Speaker A
with a gentleman by the name of Richard boys vet and he's a professional trader and money manager I've been dealing working with with Richard for many many years all right we have a great relationship he's he's produced an
72:18
Speaker A
electronic version of Taylor's book so he's really was just calling it the e-book and it's a proprietary spreadsheet all right he will not divulge the calculations from which how its created but he has been able to work out an arrangement
72:40
Speaker A
with me since we've been dealing each with each other for many you know years and I've been using his particular eBook right up until recently I have not been able to distribute it I have not been able to show it I
72:56
Speaker A
without his permission so I've been working with him over you know several months now to work out an arrangement where you know I can present it to our members and to the public all right and so what we've created is is the e-book
73:12
Speaker A
that we that I use on a daily basis to produce the daily trade strategy as so forth and so on so so the idea here is to you know everybody wants to know okay so how do you know what the levels are
73:25
Speaker A
all right well again this spreadsheet does all the heavy lifting all the the calculation all the mathematics that George Taylor did by hand but now we're able to do it electronically alright and so now we get potential levels of
73:42
Speaker A
support resistance the extremes all right and again this this shows you know what the smart money today is doing and when we blend this into everything else that we teach and we work with on a day to day basis okay
73:59
Speaker A
it forms again an outline of in a template of everything that we do and again as I said if this rounds out this methodology of mine okay that I've been really doing for you know perfecting for for well over 20 years now alright
74:15
Speaker A
having worked for the investment banks alright yes the individual ebook will be available for individual stocks and so forth here is a snapshot from Monday's session and so again part two we're going to go into the what the
74:34
Speaker A
spreadsheet looks like and again I won't be able to go through calculations of how its generated but I will just discuss the nature of the of the spreadsheet okay and as you can see here this particular spreadsheet I get on a
74:53
Speaker A
daily basis it is emailed to me I believe I already received the one for tomorrow but we got the sp500 you know emini here we got Russell and we got Nasdaq showing I think there's a ym on this particular
75:11
Speaker A
slide on the spreadsheet as well I was not able to get it into view here but it says you know possible hi for cycle day to possible low it gives also handicaps projections so for instance on cycle on Monday there is
75:29
Speaker A
a 45 percent chance of making a high above you know X price right up to a high price so there's a range of an average an average expansion to a maximum expansion all right from a maximum violation to you know minimum
75:47
Speaker A
violation okay so there's the handicapping feature on a day to day basis all right and there's an average range that occurs again we'll discuss all this in part two it's gonna take a lot more time to go into this all right
76:01
Speaker A
on on cycle day on the cycle days alright so I wanted to give you a preview and let me just show you one last thing in terms of where you can get access to this now alright so on the
76:19
Speaker A
website we have a new section under the trading tab if you were to go to the website and it's called the PPG 3-day cycle alright so much of what you've learned already here today through this workshop you'll see some references of this in
76:36
Speaker A
this particular page alright and and again feel free to explore it alright now we have a complimentary document on the three day cycle it's pretty much an outline of what we discussed here today but now we have a subscription all right
76:58
Speaker A
and right now we offer or rich and I together offer eight different ebooks based upon the three day cycle tailor method and they cover certainly the u.s.
77:14
Speaker A
index futures European futures US stocks right Paul gold silver and N products of course oil natural gas etc various soft commodities Forex Forex futures and bonds and interest rate indexes so and it's simply if you were to you know go to the subscriptions tab
77:37
Speaker A
over here alright down below you'll see a list of the three days cycle now we have each particular product that I've just mentioned is listed in here alright so if you're interested in the u.s.
78:00
Speaker A
futures or indexes or stocks etc okay each of these particular products guys is 49.95 it is not part of the ptg membership all right I have you know we've gotten the lowest price possible that we can offer anybody there is no
78:18
Speaker A
discounts to this alright this is a very very strict price but it is available to the public to all our members I have not been able to you know this was the agreement that I was able to forge with
78:31
Speaker A
them and with rich and you know this is this is worth its weight okay you see what happens on a day to day basis so if you want that particular spreadsheet you know on your desktop in the evening
78:46
Speaker A
ready for tomorrow etc etc for individual stocks or oil or gold and silver I know some of you trade gold and silver etc it's the exact same concept that we use on on the index equities and you know again it there
79:06
Speaker A
read the same way so you can use these for you know other instruments but this is now available it is on the website alright so if you are interested in you know feel free to to go ahead and
79:19
Speaker A
subscribe to it I how many stocks in in digital stocks I don't have that answer how many you know if you ask me you know I can find out for you I'm not 100% sure I I don't use it for individual stocks
79:35
Speaker A
but you know I'm sure there's a pretty good list I would imagine that if you have a specific list for individual stocks that you're interested in I'm sure the the spreadsheet will be customized to what you want but I'm not a hundred percent
79:51
Speaker A
sure you know I can't imagine five thousand you know individual stocks are you know comprised of the sheet on an individual stock basis but I'm not a hundred percent sure so we can find certainly find that out for you guys all
80:08
Speaker A
right so if you do have questions about this up you know drop me an email let me know specific questions like Paul has presented here about the individual stocks if you are interested you know go ahead you know you feel free to you know
80:26
Speaker A
subscribe however you want part two of this which we'll be discussing in more detail about the spreadsheet will be our next workshop hopefully scheduled for next week but we will see if we can get that on board otherwise that's it for the today hope
80:48
Speaker A
you even found this insightful okay and we can end the presentation here right now so thanks very much for attending this workshop and it will be recorded and uploaded to the website in a matter of a day or two thanks very much
81:07
Speaker A
everybody for attending
Topics:three-day cycleTaylor trading techniqueGeorge Douglas TaylorPTG Universitycycle day onefutures tradingsmart moneyswing highs and lowsmarket cyclestechnical analysis

Get More with the SozAI App

Transcribe recordings, audio files, and YouTube videos — with AI summaries and speaker detection. 30 minutes free.

Or transcribe another YouTube video here →