Skip to content
Get App

PTG 3 Day Cycle Part 2 eBook Spreadsheet

PTG webinar part two on the Taylor 3-day cycle, presenting Richard Boisvert's electronic version of Douglas Taylor's 1950s 'book method' trading spreadsheet and its daily support/resistance levels.

Key Takeaways

  • Taylor's 3-day cycle method uses historical observation of recurring price patterns to estimate probable daily ranges and direction.
  • The electronic spreadsheet automates Taylor's 1950s book method and delivers daily levels to subscribers before each session.
  • Cycle position (day one, two, three) and where price closes relative to the day's range are key inputs for anticipating the next day.
  • Failed cycles and three consecutive negative days may signal a change in market direction rather than a normal cycle.
  • The method is presented as a professional-style edge, but all results are hypothetical and carry significant risk.

What the video covers

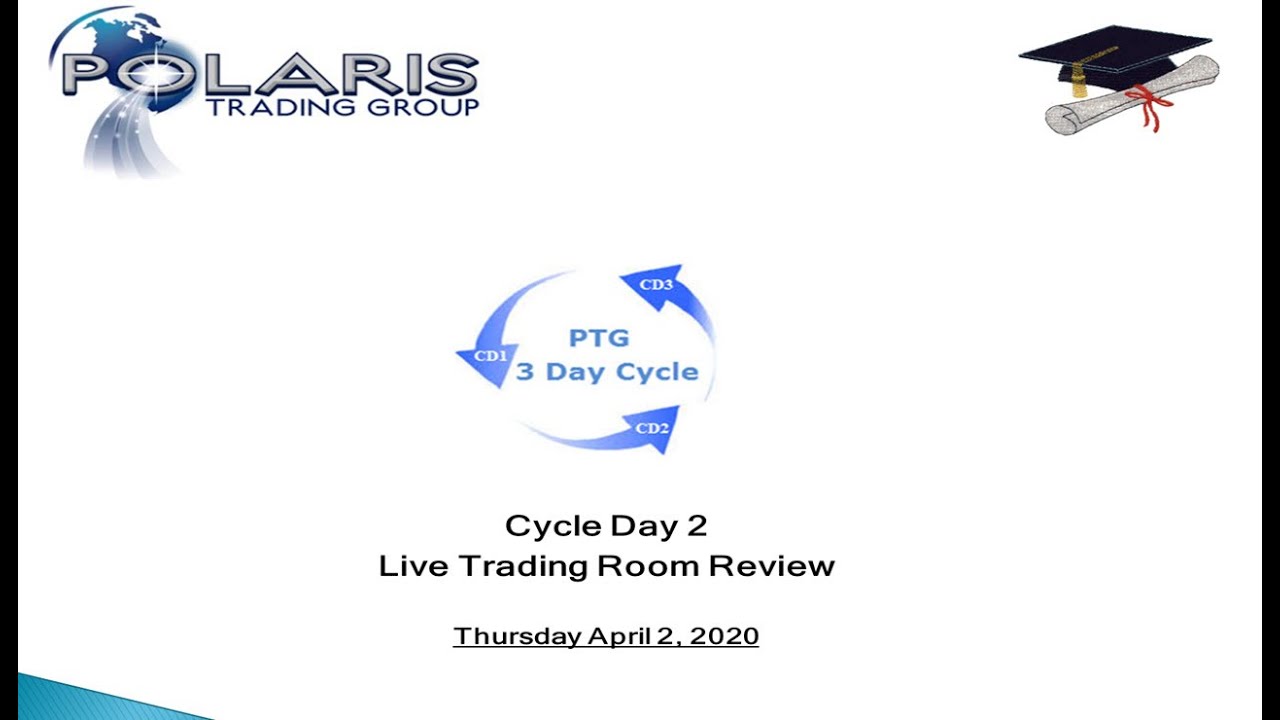
  • Webinar from Polaris Trading Group's educational series, part two of a two-part series on the 3-day cycle (Taylor trading technique), dated April 8, 2016.
  • Taylor's method, developed by George Taylor/Douglas Taylor in the 1940s-50s, identifies recurring 3-day price cycles attributed to 'smart money' manipulating highs and lows.
  • The method uses the cycle day one low to cycle day three high as the 3-day rally measure, and tracks whether closes near highs or lows predict the following day's movement.
  • Richard Boisvert, creator of the electronic ebook spreadsheet, presents the tool, which is delivered to subscribers each evening around 5:00 p.m. Eastern for the next trading day.
  • The spreadsheet provides probabilistic projected ranges, support and resistance levels, and expected extensions for each day of the cycle, usable intraday or for swing trading.
  • The presenters cite a statistic that roughly 84% of 3-day cycles are positive, verified over 2008-2009 including bear markets.
  • Discussion covers how cycles reset after failures, how to interpret three consecutive down days as a possible trend change, and the distinction between 24-hour and day-session charts.
  • The presenters stress that the material is hypothetical, past performance does not guarantee future results, and futures trading involves substantial risk, citing NFA compliance rule 2-29.

Answers

Questions about this video

What is the Taylor 3-day cycle trading technique?

It is a method, attributed to George or Douglas Taylor, that identifies recurring 3-day price patterns driven by institutional 'smart money' moving price between highs and lows. Traders use it to estimate probable daily ranges and direction.

What does the electronic ebook spreadsheet provide?

Subscribers receive a spreadsheet each evening around 5:00 p.m. Eastern with projected support and resistance levels for the next trading day, based on the cycle position and probabilities from Taylor's book method.

What statistic is cited about 3-day cycle rallies?

The presenters state that about 84% of 3-day cycles are positive, and that this was verified in 2008 and 2009 even during bear markets. The statistic is presented as historical and does not guarantee future results.

Full Transcript — Download SRT & Markdown

00:02
Speaker A
All right, good afternoon everyone. Uh, welcome to the Polaris Trading Group's PTG educational series. This is a special webinar we're doing on a Friday afternoon. Today is April 8th, 2016.
00:15
Speaker A
And this is part two of a two-part series on the PTG 3-day cycle, also known as the Taylor trading technique.
00:27
Speaker A
And this is our module 16. What we'll do today is we're going to take a look at the uh ebook, electronic book spreadsheet that uh Douglas Taylor uh created and in his book method and we're going to take
00:43
Speaker A
a look at that. We have a special guest uh Richard Boisevet who will uh he was the creator of the ebook spreadsheet and he'll take us through some of the detail aspects uh of that.
01:05
Speaker A
Okay, does everybody see the disclaimer sheet? You did not see the disclaimer sheet. Okay.
01:30
Speaker A
Okay, now we should see the disclaimer sheet. All right, terrific. Okay, so uh industry regulation uh requires that we at least highlight the NFA compliance rule uh 2-29 and that says that hypothetical performance results may have u many
01:49
Speaker A
inherent limitations. and some of it described below here. And trading in futures and uh options on futures and derivatives are speculative in nature and involve substantial risk of loss and past performance is not indicative of future results.
02:07
Speaker A
Okay. So before we get going with uh our special guest Rich, I just want to uh quickly review uh back on March 23rd, we conducted our part one of the uh 3-day cycle, also known as the Taylor trading technique.
02:29
Speaker A
And in that we highlighted that just some background on the cycle that the uh tailor trading technique was invented by George Taylor back in the 40s and and again he he used a he developed a short-term technique uh to identify
02:46
Speaker A
underlying patterns in in trading that uh you know with the inherent choppiness of the markets he was able to uncover some patterns that tended to repeat themselves over and over again.
02:59
Speaker A
and they uh he recognized that these patterns re recurred on a 3-day uh type of cycle basis. So he simply adopted the view uh in his observations that the markets are being driven or as he stated manipulated by smart money. So these are
03:18
Speaker A
some of the bigger institutions, larger traders and so forth. And they move price around from highs to lows in order to position themselves and then reposition themselves all right to take advantage of the supply and demand um equation that was going on through the
03:36
Speaker A
marketplace. So his core premise of course was that the markets were actually manipulated in stages uh by these smart money and repeated over and over again. uh on a on this uh consistent 3-day cycle uh basis. So what
03:52
Speaker A
he ended up doing was recording uh the highs, the lows uh on certain days and then he compared these same days and noticed that they fell within a certain range and then at other times they extended the range. So he he
04:11
Speaker A
recorded all these various observations that occurred and and he recognized that there was a a fairly consistent pattern.
04:22
Speaker A
So in doing this he was able to um in a way have some insight into what the potential for a particular trading day um how it would unfold or at least a probability of how it would unfold. uh
04:39
Speaker A
before it actually did. Uh if the market traded traded and closed high in the range, what did that infer? Well, he would take a look back at his recordings and he would identify that there was a certain probability
04:56
Speaker A
that if the market closed at or near highs of session on certain days, then the following day there's a probability of the market extending further in order for the uh larger institution or quote unquote smart money uh would be able to either exit
05:16
Speaker A
positions, all right, or uh and reestablish new positions at upper and lower edges. So, we know that the the larger institutions out there such as the mutual funds are the big money and they control everything that goes on in the
05:32
Speaker A
marketplace. Everybody else is just kind of following along and so forth. So, what we're trying to do with uh to give you guys an understanding of the three-day cycle and how many professionals even to this day, all right, use it and I know several
05:47
Speaker A
professionals that are actively using it uh throughout and they use it either on an intraday basis as as we use as a guide or they're using it on a swing trading basis, right, to position themselves very similar, right, to what
06:03
Speaker A
uh Douglas Taylor recorded and and observe. oberved um back in the ' 40s. The markets don't change a whole lot.
06:11
Speaker A
How the markets change, how the markets are traded. Uh now they're you know fully electronic and um but really the the nature of the markets uh have not changed since the beginning. So this this book method that uh Douglas Taylor had identified uh is
06:29
Speaker A
effective today. And so, uh, what our special guest, Richard Boydvet and and again, we, uh, welcome Rich here today and we're very happy to have him, uh, take his time out of his his busy day.
06:43
Speaker A
It's it's the beginning of his weekend. He's, uh, six hours ahead of us, so he's it's early evening on a Friday and, uh, we welcome him here. So, what Rich did is um, he read Taylor's book. Uh it's not
06:59
Speaker A
an easy book to read by any stretch and Rich really kind of pulled it apart and was able to uh look you know uh really deep into uh what Douglas Taylor actually saw and he with the electronic markets that we have today uh he created
07:17
Speaker A
he basically he took the the old book method and created uh the an electronic book method spreadsheet.
07:24
Speaker A
So that's what we're going to discuss today. All right. And the and the beauty of this is I've been using this for a number of years myself uh Rich's work.
07:36
Speaker A
And what the beauty of it is is with the ebook. All right. uh we don't we don't only have a better idea of the direction of the markets but also the possible levels of support and resistance based upon certain probabilities
07:51
Speaker A
and the expectation of moves on uh particular days and again each day cycle. So uh the the so today's electronic version that we're going to discuss today and Rich is going to present on is Taylor's 1950 book method
08:06
Speaker A
but now in electronic format for everyone and the the interesting statistic about this that is as in the last line in this slide shows that even in bare markets and these this has been actually verified um back in 2008 and
08:23
Speaker A
2009 where even in bare markets is the smart money actually creates a positive 3-day cycle rally over 84% of the cycles. So that's a very very u positive statistic and I think part of that is because uh the mutual funds who drive the big
08:43
Speaker A
money are primarily uh long only type investors traders and there's a natural tendency to move prices um you know higher but even in down markets the qualification of a a three-day cycle rally um falls into place a very high
09:06
Speaker A
percentage of the time. So this is a very good way and I think it's important that we uh get a greater understanding of this. This is a core part of uh Polaris Trading Group's methodology.
09:16
Speaker A
certainly not the only but it is a core part and um I think it's really important for our members and those of interest in in the cycle to get an understanding of how professionals uh view and operate out there in the
09:32
Speaker A
marketplace. Uh that type of knowledge is an edge in and of itself. So it's important that we have whatever possible edge that we can we can have. Okay. So, with no further ado, um I'm just going to uh show you one slide. All right. And
09:49
Speaker A
this is today's uh spreadsheet. This is what you'll uh be getting as a uh subscriber to this uh service that we're offering. And uh it's delivered to your uh inbox uh every evening at about 5:00 p.m. Eastern time.
10:04
Speaker A
And it's set up for the next day. So, those of you that are trading the uh European session uh overnight and early morning, uh you'll have all access to the uh levels for uh your time period, right? As well
10:20
Speaker A
as it comes into the um cash session as well. All right. So, with that, um what I'll do here is I will switch uh shut my screen off and I will switch over and give the floor over to Richard. So, uh
10:34
Speaker A
say hello to Richard. and Richard, go ahead. Uh, take it away when uh you're you're able.
10:44
Speaker A
Hi, everyone. Um, let me find a way to get my screen. Which screen I'm supposed to present here? Um, what screen do you see, David?
10:58
Speaker A
uh you're going to need to uh once you highlight it on the drop-own menu, then you're going to have to click show my screen.
11:11
Speaker A
I know we did this last night, but So, just highlight your screen on the dropown menu.
11:23
Speaker A
I'm looking for the drop down menu. It's in that little box that you got to expand it out perhaps.
11:37
Speaker A
So sorry. Um if you'd like I can uh show my screen and you can talk either way.
11:48
Speaker A
Um, yeah. If you want to put on the um the report from last night or today's report. Sure. I I'll actually do that.
11:59
Speaker A
I can't believe I can't find that stupid thing. Not a problem. Okay, there you go. This is uh the report for uh today.
12:12
Speaker A
Okay. So on here we have uh we have many numbers. Um except now I'm pointing with my um mouse and it's not pointing at the right place. So we need to find a way to Okay, Rich, just tell me which line you want
12:33
Speaker A
to highlight and I will highlight it for you here on the screen. Okay. So basically I'm going to start with um the first numbers at F456 and H and so on so forth.
12:50
Speaker A
So basically these numbers are yesterday's data like your high for yesterday on the pre on the low just below on the line just below that is the low and then the the sell day or the buy day low or the cycle day one low which
13:09
Speaker A
is the the three numbers you see in the F column and then the H column is the same thing except it's based only on the day cycle I mean the day uh the day session as sorry for my mistake here um
13:24
Speaker A
then we also have the SPX only the SPX is available the other ones are not but it's same number same thing high low and uh cycle day one low if we have a cycle you know if if we're on the right day of
13:40
Speaker A
the cycle um below that you have in blue the possible high for a cycle day three a well there's two different ways of calculating it one of them is based on the penetration in other words if we if
14:00
Speaker A
you read or saw the previous webinar penetration is when we get above the previous day high so in this case we have 75% chance of getting above the previous day high of um by 1468 if you follow the line all the way
14:26
Speaker A
across. Um the average cycle day high should be 2075 and that's based on the average 3-day rally which is 40 um 40 points and that's calculated from the bite the cycle day one to the um cycle day three
14:50
Speaker A
high I mean cycle day one low to the cycle day three high. Um then we also have the violation levels which are on line nine and those are the percentage. So in this case as you can see we don't have the odds of
15:06
Speaker A
getting a violation were very low. Uh looking at today's chart however we did get a violation. Uh no hold on that violation was yesterday or today.
15:18
Speaker A
Um yes we still had a violation. No we didn't get a violation. We were below the buy day low today at the open of the GlobeEx session and once we got started we had to get above. Yesterday we closed
15:35
Speaker A
even below the um cycle day one. Sorry if I call it buy day. It's my old tailor deformation instead of cycle day one two three it's buy day sell day sell short day. So um we just have different verbiage but
15:51
Speaker A
it comes to the same thing. Um but yesterday we were we closed or we you know like at 3:00 in the afternoon we were quite a few points uh we were 10 points below the uh cycle day one low.
16:06
Speaker A
So we had we knew at that point we needed to get back above at some point of the in the day today. So David just mentioned 84% of the three days 3-day cycles are positive. Well, it's more than that
16:23
Speaker A
today. We're in 90% plus. Uh those 84% were during the uh 20089 crash or bare market. Uh that um it was still 84% at that time. Today, because we've been in a rally mode for quite a few years, now
16:43
Speaker A
it's at 91 92%. Uh matter of fact, uh for the last three months, uh it's 95% and if uh David was to click on the recap page, uh you would you would see that it's at 92%.
17:03
Speaker A
So that's for ES. The other one is 91, 91, 92. So it's, you know, roughly the same thing. Um, and even for the day session, it's still in the 86 87 plus.
17:16
Speaker A
So, it's been it's been good predictions from Taylor. I mean, I I'm shocked myself sometimes how precise it is. If you want to go back to the EMA page David.
17:32
Speaker A
So, those are the numbers in that section in the blue se blue part here.
17:37
Speaker A
It just explains it better than what we saw in the line 7 8 9 in the blue section. It explains it a little bit better. U it says, well, okay, today is a cycle day three. ES therefore should
17:52
Speaker A
have a 75% chance of making a high above 2062 and possibly as high as 2076.
18:01
Speaker A
Um, well, so far it hasn't happened, but we had a 95% chance of making a high above 2035, which we definitely did, and we could have gone as high as 2075.
18:16
Speaker A
Those numbers are based on averages. Um, as you all know, averages is averages. Uh, but, uh, a lot of the times these numbers are very accurate.
18:28
Speaker A
And we had 25% chance of making a violation or making a low below 2026 which we did for a few no sorry we did not do in this case today and possibly go to 2018. So 25% didn't happen. And
18:46
Speaker A
then if you look at the yellow section just below that um those are for the day session only. So 80% chance of going above 201 which we did. We did not reach the target of 2065 but we got above 20 51.
19:04
Speaker A
Uh we had a 95% chance of going about 2035 which that was accomplished and 30% chance of below 2026 and that never happened. the line 19 the day session high 48% those are numbers that I started when I
19:25
Speaker A
got started with the program but uh today it's too close to call because it's 8 years worth of data and after 8 years this number is just too close to to be worth anything I mean 48% 49 50 51
19:43
Speaker A
who cares I mean that's too close to use I don't use that part anymore are the only thing once you learn about Taylor is that if we close on the highs of the day or if we close on the lows of the
19:55
Speaker A
day that's when you know what to do the next day or close to the highs close to the lows then you know what to expect the next day um when it comes to using this um number there I don't believe it I don't
20:12
Speaker A
believe in it so much so I would forget that line I should even remove it from my reports Um, if we go to the little higher section in the blue, uh, numbers in blue here, um, the odds of a 3-day rally greater
20:28
Speaker A
than 10 points is 83%. The odds of a 3-day rally greater than 20 points is 55%. And the odds of a three uh, of being below is 8%. Um if we look at this 83 uh going above 10
20:48
Speaker A
points well today we went uh from calculating from the uh the cycle day one low which was 2035 we went to 54 so that's 20 points or just about 20 points. So um 19 if we want to be precise. So basically, we
21:08
Speaker A
knew we had 55% chance of getting that far up. So once you're in a trade, it gives you a chance to stay in a little bit longer when you know you've got these uh these odds with you. So if you got into
21:25
Speaker A
a trade early this uh in the night or if you got in what did we open at this morning?
21:34
Speaker A
Well, we open pretty much halfway up to the top. So, which is okay because today was a sell short day. So, we shouldn't be looking for longs on the sell short day.
21:44
Speaker A
So, once we reached the top, it was a good place to get in for a short and so far we would be in the money for 15 16 points. So, that's okay if we managed to get in at the top. Um, in this case, we
21:59
Speaker A
knew we had 20% I mean 55% chance of getting 20 points. Once we got to 19, well, we knew we probably exhausted the whole thing. Uh, we also knew that we have an average day range of 33 points
22:15
Speaker A
or 3294 and we started at the bottom at 30. So, we were up to 24 already. So, uh if you had some other um indicators or some other um personal indicator that you use, then you could uh end up um
22:37
Speaker A
finding a way to get into a short close to the top and then just run it and get some good money out of it. Um at this point, I think I've explained most of the chart. I was going to show you the
22:51
Speaker A
charts and stuff, but since I can't find a way to show my screen, I guess I won't show you the charts. Um, any questions?
23:01
Speaker A
Yeah. So, uh, guys, if you have any questions, uh, type them in the room.
23:05
Speaker A
Uh, what I'd like to talk about a little bit further is just a discussion about, uh, how to use the odds of of a of a three-day rally and and so forth on a day-to-day basis. Uh remember the uh if
23:16
Speaker A
correct me if I'm wrong Rich, but the the odds of a 3-day rally, there's calculations at the top right hand corner here. Uh those are measured off of the uh buy low or the cycle day one low. So that being uh at 2035
23:32
Speaker A
uh the way I like to use this uh myself personally and and how I try to present to our members is that um we always want to know where we are where price is that is relative to the overall range uh you
23:46
Speaker A
know or the expected range on a specific day. So let's just take a a moment here for a moment. It says the average range on cycle day 3 is 32 spot 94. Now that's the average range that has been observed
24:02
Speaker A
on cycle day three over 20 cycles. So the recap MA page here represents in terms of time 20 3-day cycles. So that's uh almost shy into three months. And so that's quite a quite a bit of uh you know information
24:23
Speaker A
and the average range that have been observed on cycle day threes all right is is just under 33 handles. Now that's much different than the 10day average true range which we use sequentially all right on a rolling basis uh we speak
24:39
Speaker A
of every day. So, it's interesting and and it's very important to note that the type of day we're on, what is the average range for that day and then we'll know what the sequential day 10day average range is. All right? Uh using
24:58
Speaker A
the 10day average. So again like so for instance given the day like today um we had a 55% chance of rallying um what 20 handles or greater right so 2035 right plus 20 is is 20 55 correct okay
25:19
Speaker A
so let me do this let me see if I can pull in a chart here okay does everybody see that chart this is our uh five minute uh balance chart that we use every today. And so if you
25:32
Speaker A
take those calculations in mind that I just showed you, right, there's a 20 there's a 55% chance of a 20 handle move from the buy day or cycle day one low. All right. So I use it as, and correct me if I'm wrong, I think
25:49
Speaker A
Rich uses it the same very similar same way because I've learned from Rich is to use it as a risk barometer. All right.
25:57
Speaker A
Um we saw it today with a gap up and everybody thinks that's bullish. Now normally it would be but depending upon the context uh it may not necessarily be. So if you take into consideration that today we had a 55% chance of a 20
26:14
Speaker A
handle move on cycle day three. All right, that brought us to the 2055 uh expected uh potential high based upon that uh observation and that projection.
26:29
Speaker A
Well, you can see here today at 2054 uh 25 on the high. Well, we knew at these levels and our members, you know, u will attest to this today this morning during our trading that I was not familiar with
26:43
Speaker A
the um famili uh not familiar but not interested in rather of taking longs up here and we actually ended up taking uh some shorts uh on the way down to the opening range and then uh on a break of
26:55
Speaker A
the opening range. We're on our way to actually almost closing the gap here. So, this is a perfect uh cycle day three type day where the the large institutional quote unquote smart money, all right, forces prices higher, all
27:11
Speaker A
right, to exit their positions that they bought much lower yesterday on on the violation of 2035.
27:20
Speaker A
They unload their positions and then reposition themselves to the short side. Am I correct uh with that, Rich?
27:27
Speaker A
Yeah, definitely. That's what uh the game plan was was to get a higher uh than yesterday and then short it again this way. That's what the sell short day is for or the cycle day three is to short all day long normally. And
27:42
Speaker A
this was a perfect example of a perfect um cycle day three. Okay, great. Um I have a question here.
27:51
Speaker A
Let's see. Manfred is is the three-day cycle meant literally i.e. three consecutive calendar days even if one or two of the of the three-day cycles are without much movement. So, could you address that, Rich? Yes. Uh three-day cycles uh is for every day the market is
28:11
Speaker A
open. And when I say the market is open, even if it's open for half a day, like on President Day or Martin Luther King Day or whatever other holidays we get, Fourth of July and so on so forth, um
28:23
Speaker A
those are counted as days. Uh the only days now in the last two three years that the there is no trading is Christmas, New Year's and Easter if I'm correct and those are the only three days that are not counted.
28:41
Speaker A
Weekends are officially not counted. That's definite because the markets are not open whatsoever. So and the mark and to answer the second question which is uh is it ever advisable to reset the cycle? I've never reset the cycle since
28:57
Speaker A
the get-go. Um, well, I shouldn't say that. I did it in the first year to try to figure out what I was doing all this to realize that I was every time I've reset it, it was wrong. So, I've went
29:09
Speaker A
back to the original um uh cycles that I had figured out. And the way I figure out if it's wrong or right, if if I um run my my program and I say, "Okay, the first day of data that
29:27
Speaker A
I have, I put it as cycle day one and see what my percentage of positive 3-day rally is." And then I do the same thing for cycle day two and cycle day three and pick the highest percentage.
29:41
Speaker A
Um, once I do that, I go back in time and I pick, for instance, the low of March 6, I forgot the year, 2009 or eight, whatever it was. Um, and that should have been a buy day. And sure
29:57
Speaker A
enough, it was a buy day. And so that cycle that we have today is still accurate. Um I and Taylor really don't believe in um changing your cycle. Once it's there, it's there. It's yes, you have some failures and well that's part of the
30:18
Speaker A
game. I mean you you can't say every time you have a failure, well the program doesn't work, let's change the program. You just have to adapt to it.
30:26
Speaker A
Usually if you have one failed day cycle, uh it will fix itself. uh failed three days there sorry cycle uh it will fix itself within the next two or three days and everything will be back to normal. Um if you get two or three
30:42
Speaker A
failed three-day cycle in a row or very close together that's usually a change of trend. So it is usable to I mean you can use the information for the right purpose if you're trading it properly.
30:58
Speaker A
Uh if like I just said, if you get three in a row, uh you know darn well something's wrong. Uh the market is changing directions.
31:07
Speaker A
Um we've seen that a few times in the last few years when we you know we get some kind of bare market during this the year. So um so I never change the cycles. They stay put. It's three days and the only
31:24
Speaker A
weekends are not included and the only three days that are not included is Christmas, New Year's and Easter. Uh, is it advisable to is it advisable to reset the three-day cycle? No. Okay. So, we don't reset the I think the next question, David, is for
31:42
Speaker A
you. Okay. Uh Mike asks, "Okay, so where do the max and the non-max values come from?" All right, what's the difference?
31:52
Speaker A
So, uh, in other words, uh, how's that interpreted from the spreadsheet? So, I think what Mike is asking is every day on the daily trade strategy, uh, report, is that what you're asking, Mike? Uh, I believe every day, uh, what
32:05
Speaker A
I do. Okay. So, let me just pull in what I send out on the daily, uh, trade strategy each and every day.
32:13
Speaker A
Um I I manually highlight these. All right. Cycle day one, cycle day two, high, low, etc. And then what I also do is I put in a maximum penetration level on CD for CD3 u maximum violation level for uh CD2
32:32
Speaker A
etc. cycle day one. So I label these manually on on this particular chart. Uh the average 3-day cycle target etc. So, what I do here basically, um, it's it's a little interpretation.
32:45
Speaker A
All right? And it works, uh, probably a little bit better with the, uh, e- minis. Um, but what I really do is I take a look at on the recap MA, right?
32:54
Speaker A
Again, the recap MA represents 20 3-day cycles. All right? And so, what I do is I take a look here on on line seven. All right? And then so it says the possible high for today cycle day three um is 76
33:10
Speaker A
and change and then 65 uh for the day session. Okay. And then also what I do is I look at the recap.
33:18
Speaker A
All right. And on the recap same line. All right. I look at the same possible high uh here at 70 for the 24hour session and 59.84 for the cash session. So uh what I basically do is I uh most of the time
33:32
Speaker A
what I'll do is I'll take the maximum value of either of those that have been observed either the most recent 20 cycles or from the beginning of the spreadsheet itself which is more what I would consider raw data. Okay. Um but
33:48
Speaker A
they're averaged but it's over since the the very beginning. So uh the recap MA in a sense is the more re most recent and um the recap itself is is all the data averaged out. So it's a little
34:04
Speaker A
interpretation uh I do um it you know you can simply take the highest maximum.
34:10
Speaker A
So in effect in effect what you really can do is um let me just pull in the chart here once again is if you want you could actually create a zone of a uh cycle day three uh minimum like minimum
34:28
Speaker A
max potential level and then a maximum max potential level in a sense creating a zone based upon the uh highest two maximum values uh being observed over the uh recap MA period or the recap period and that would form a you know bit of a zone
34:50
Speaker A
because again the although I've experienced u that some of these levels get uh hit almost to the tick many times and it's you know sometimes we scratch our head for that that the fact that it does that um but the market is you know
35:08
Speaker A
is more you know uh I always refer to you know zones of importance rather than you know one particular price point because the institutions simply are not able to buy and sell the type of quantities that they are looking to do
35:24
Speaker A
uh at one particular price point. So zones tend to be much more uh important.
35:29
Speaker A
So there's a way, Mike, that you can, you know, you can take a look at the data on the sheet and uh just draw two lines, upper lines and lower lines, and call them a um minimum max or a max
35:41
Speaker A
minimum and a maximum maximum penetration level. You can do the same thing to the downside. And again, using both aspects of the uh of the spreadsheet, um I think that's an effective way uh to use it. And it's a
35:55
Speaker A
little interpretation, but uh that's how I would find it. And that's how I do find it. And it again, it creates a zone. All right. Does that help? All right. Um let's take a look at another one. Um let's see. So in other words, go
36:11
Speaker A
ahead. I I think the next one is what constitute a that's David's question. What constitute a failure in a cycle? Uh basically a failure in a cycle is that if we fail on the sell short day to be
36:25
Speaker A
above or sorry cycle day three if we fail to get above the cycle day one low uh it's very rare like we see I mean it's 90 it's 90 some odd percent positive so therefore it's only 78% negative so that's the failures are just
36:45
Speaker A
happening 8%. Um you just pointed or David just pointed out uh the recap MA sheet which is 20 cycles uh worth of data. If you look at the recap page that's 8 years plus of data since January 1st 2008 so we have a lot
37:03
Speaker A
of long history here and that is 92% positive in that thing. um assigned to these projection how you well that's what I just said. So basically that's how we know if it's a uh a failure. We know right away the pro
37:26
Speaker A
probabilities of getting a failure or not getting a failure but right now the failures are very uh very rare. So rich what I did is I just put up a slide here um that what constitutes a three-day rally. So, in another way of uh
37:43
Speaker A
answering David's questions about what constitutes a failure, all right, you may want to just if you want just review here for a moment what actually constitutes a positive 3-day rally. I know you did mention that it needs to be
37:55
Speaker A
above the cycle day uh one low uh at the beginning of cycle day three, but I there are a couple other uh pieces here that uh if you want to review that would be great.
38:09
Speaker A
Yeah. Um, I mean, basically, you just pointed it out. I mean, the the 3-day rally is calculated from the cycle day one low to the cycle D uh cycle day three high. So, this needs to be positive and or needs to be. I mean,
38:30
Speaker A
it ended up being positive if you're on the right cycle and it's been positive right now for 91 92% of the time. Uh the that's basically my core premise of whole about Taylor is that this needs to be a positive number
38:53
Speaker A
and it's just a matter of subtracting one number from the other. So, okay. I just I just changed the odds I just changed the odds there from 84 to 92% on the spreadsheet.
39:06
Speaker A
Okay. And you and you can see from the um the last three months. I mean, usually it's always around 95. So, there is one failure every three months, six months. Uh that's part for the course. So, okay. So, uh, David has another Dave,
39:26
Speaker A
uh, has a question that the difference between a sell short day and sell day.
39:32
Speaker A
If you answered that already, forgive me. Uh, uh, okay. So, what's the difference between a sell day again and a and a sell short day? Let's answer that one. Okay.
39:41
Speaker A
Basically, in a perfect world, um, on the buy day or cycle day one, we're looking for and once the low is in, that's the start of the 3-day rally.
39:54
Speaker A
From there, it rallies to the high of the sell day or cycle day two. Once you reach that high, that's when the big boys are getting rid of their position.
40:07
Speaker A
And then because they have so much to unload, I mean it takes time to unload.
40:11
Speaker A
So they're unloading all their stuff on the sell day high or around the sell day high. After that it gets up often. I'm saying on a perfect cycle it continues rallying because now you know mom and pop are just getting into the market and
40:27
Speaker A
pushing the market a little higher as they're saying, "Oh, we're missing the boat." So they're trying to get on get on the boat. By the time they finally all get on the boat, that's when all the big boys shorted and sold them all the
40:42
Speaker A
shorts they wanted. And then when there's nothing left to sell, then markets just drops down. And that's what happened today. Just drop down. Now in this case uh you know it tomorrow in in principle we should continue going down violate uh
41:00
Speaker A
today's uh today's low and that would be around that area that we should be looking for a buy low. I mean they'll we will also have numbers to help us with that but I don't know what the normal
41:14
Speaker A
numbers will be for tomorrow. phone. All right, that's in principle the three day cycles the way that we calculate it and the way it's figured out. Great. So uh John has a question about does the failure of any cycle have any
41:29
Speaker A
significant for the next cycles and is there any have you found any correlation that on on even though the cycle failures are relatively rare um about what 5% or so uh 7% of the time um do they have any real significance or does
41:45
Speaker A
the cycle kind of reset itself after a failure or what would it if there's any implications on that? often it resets itself in in a weird way. For instance, if we have a failure on the sell short I mean
42:00
Speaker A
obviously it's on the sell short day. Uh often you'll have a crazy buy day that you will not uh even have a decline.
42:07
Speaker A
You'll just start rallying right away. Um so it that's when it's really an official uh or a fake failure.
42:20
Speaker A
then it starts um negating itself on the next day. The same thing as we if we fail to have a decline on a buy day, which is extremely rare. I think we're looking at the 1% range. Um again, when those things happen,
42:39
Speaker A
they will most of the time when these things happen, they will happen like on a Monday because you have the weekend and then you start with a gap up or down and mess up the whole system.
42:50
Speaker A
Um those are the most um uh that's when it happens most of the time is after a long weekend. I mean a weekend uh long weekend even makes it worse but that's another thing. So but normally it resets
43:10
Speaker A
itself within a day or two. Okay great. you know, that's what I've I think that's what I've observed as well, especially if there's also uh you know, geopolitical announcements that have gone out there and it kind of does
43:23
Speaker A
disrupt the cycle uh somewhat. But, you know, I I kind of relate it to uh a kayak, you know, going underneath the water and then, you know, the kayak or flipping back up and eventually it's going to come right back up and then
43:37
Speaker A
it'll it'll reset itself, you know, uh properly. So there are times where it definitely uh gets disrupted but it doesn't stay disrupted for long because the markets uh adjust to you know whatever has affected it and and coming
43:53
Speaker A
back up. Um, one thing I've observed in in these past couple cycles is that um the cycle day one low and I think you just mentioned it was truncated meaning that the um the price here as you can
44:08
Speaker A
see on the screen uh the end of cycle day three low here and then the beginning of this uh the prior cycle uh to the one we're currently on uh it was a truncated u cycle day one low. So
44:22
Speaker A
again I the premise of trying to find that uh secure low on cycle day one uh the question becomes for for the marketplace uh you know is this particular cycle day one uh the secure low or not and the market
44:39
Speaker A
always you know is is generally will come back and test a key uh low or high to make sure that in fact that low you know is secure from which they feel confident to rally. But what I've noticed is that times where we have a
44:57
Speaker A
truncated cycle day one low and then you get the rally on cycle day one uh that that pushes up to this to the cycle day two high and and meets targets there that a lot of times like we saw this
45:11
Speaker A
this most recent cycle what you see on the screen here is that prices will come right back down. they just don't even stop and they come in and violate that cycle day one low and push it even lower, right? To uh to really kind of
45:25
Speaker A
squeeze out all those um first they squeeze out some shorts to the to the upside and then um and then uh trapped all the longs as well and they and they you know punched them out to the downside and then today what happens
45:41
Speaker A
they rip it right back up. All right. So, uh, but what my point is is I found that when they have truncated cycle lows like this, it's not really, um, you better be cautious because this is not usually the secure low, they usually
45:56
Speaker A
come back and test that though on a cycle day one, if that cycle day is below the cycle day three low. All right? And again, many times the uh decline actually begins. All right, the cycle actually begins on cycle day three
46:14
Speaker A
into cycle day one. Um, you know, at uh like here I got a line here that says the average decline on cycle day one. So this line here that I I posted a couple uh few days ago. This was actually the
46:29
Speaker A
average cycle day decline projected on this past cycle day one that you're seeing on the screen. Though it of course it never reached that. So what happens all right on cycle day two many times it comes back tests that original
46:44
Speaker A
cycle day one low to find out if in fact that is secure and many times my experience has been uh using this is that it does not hold and then and they blast through it right to either a lower
46:57
Speaker A
day range projection or or eventually coming very close to that average cycle decline that should have in a perfect you know case occurred on cycle day one.
47:07
Speaker A
it occurs on cycle day two. Then that sets up the odds is what we were speaking of today. Uh I think it was 83% of getting a rally from the cycle day one low. All right, up to a projection
47:22
Speaker A
on the cycle day three high which again today was about 55s. All right. So, you would then project it from that uh cycle day one low up and not from the cycle day two low, although that's in a that's
47:35
Speaker A
a a deep low. All right. And you can take a measurement from there, but um the the true way, I believe, Rich, is to take it from that cycle day one um up to the projected levels that it's uh uh
47:48
Speaker A
indicated and to get the um to get the projected levels. So that gives us that 55 today. And though it's not easy necessarily to be able to follow this cycle at first blush, uh it takes a number of you know days, weeks, months
48:08
Speaker A
to truly get an understanding of how this um you know, how the cycle works.
48:13
Speaker A
But the projections are very accurate and I do my best for our members to to interpret them and and give everybody the guidance uh possible. Let me uh Manford asks us a question here.
48:26
Speaker A
Uh if the big mutual funds etc are driving the 3-day cycle, right? Doesn't the high highs and lows of the S&P are more meaningful than the overnight ups and downs in the ES? So the so the cash S&P versus the uh GlobeEx uh futures I
48:44
Speaker A
think what what Manford's asking you you want to address that Rich? Well the I mean that's why we have different numbers. I mean we have the GlobeEx 24 hours the Globe uh the day session and then the um S&P
49:02
Speaker A
um they all have their meanings and they all have their importance. I personally use a 24-hour chart uh and a day session chart. And I have day session numbers and 24-hour numbers. So, I put the respective one on each one of my charts.
49:22
Speaker A
Um I think I might have found the button. Uh when it says webcams, David, is that the one that I'm supposed to press? Uh only if you want to see everybody looking at you.
49:34
Speaker A
Oh, no. I didn't want to look at me. I didn't want to look at my charts. Okay.
49:37
Speaker A
No, it's it's it's the one it's the button that says show my screen. It's the big blue one on the right on the left hand side next to the mic.
49:48
Speaker A
Where you turn your mic on and off earlier. Okay, that is nothing next to it. Oh, that button is gray. So, okay.
49:55
Speaker A
So, I'm not fully authorized. That's why. Okay. I think I can change the presenter here.
50:04
Speaker A
Let me just Oh, okay. Now I can see it. Okay. You should have control of the screen. Uh, show my screen. Which one is showing?
50:21
Speaker A
Which one are you seeing? Um, I see one of your charts. Okay. With the Skype, the Skype window.
50:32
Speaker A
Skype. Oh, no. Okay. So let's just a second. Okay, I see the sell short day chart. Okay, let me get rid of the other stuff off of here. 13.
50:50
Speaker A
So I have a chart here which is basically a 13 range chart of ES and this is what I'm looking at during the day. I mean, I have uh my lines are already on the chart for the previous
51:02
Speaker A
day high, previous day low, the buy day low, the possible uh possible levels that we could achieve up and down, so on so forth. Uh and then I can do this the same thing for a day chart and put the day chart numbers. Um,
51:23
Speaker A
I can even superimpose them and just 24. So now if if I want to now I have the day session and the 24hour session all in the same chart. So you can see here there's a lot of resistance at this area
51:44
Speaker A
and there's some support way down here. But so far we've been playing with the previous day high and previous day lows or by day low and previous. So that's what I'm looking at when I'm looking at my charts.
52:02
Speaker A
So the same thing I mean I could do the same thing for the S&P but I I prefer to just use um you know two different charts. One of them um on the 24 hours I usually use a range chart. On a
52:20
Speaker A
um day chart I'll use a 5 minutes or 15 minute chart and put the day numbers on that.
52:27
Speaker A
So I could change this to day numbers 15 minutes and then that that is uh sorry I didn't prepare for that part but cmeth and then just remove um the first one.
52:53
Speaker A
So now I have my day session numbers to go with um with the 15-minute chart. So those are the charts I would have normally open.
53:05
Speaker A
Right now I I hadn't prepared for all of this, but anyway, this is what I have normally on my trading day charts.
53:13
Speaker A
All right. Uh David asked, uh so how would you use the 13 point range chart that you're showing? Uh and you know, how how what would you do? How do you, you know, how would you trade? What would you do? What would you look for?
53:26
Speaker A
Uh, that type of thing based upon the levels. Well, um, it all depends of I mean, normally we're supposed to be using, you can't use only a tailor to get in or out of a trade. Um, it's very hard to um
53:49
Speaker A
just pick uh you said 13 range. I'm trying to get back to that. So, I mean it's it's hard to u I mean I was using u or I'm using sometimes I right now I'm not trading ES very much.
54:15
Speaker A
I'm more trading oil but I back in the days of ES I would be using a u uh what is it called a certain program anyway that uh would be working on IOT waves. So here I would be looking for my
54:31
Speaker A
fifth wave or wave three to start and so on so forth. So um at that time this program just calculated everything.
54:41
Speaker A
Another thing I would be also using is Fibonacci retracements and projections. And those are all things. And then usually I use a um um stochastic uh divergence indicator to show me that um you know we've got divergence to go
55:02
Speaker A
with the the entry point and at this point yes I'd be interested in getting in this trade at this point. In this case you had to go short at the top. Um there's different ways. I mean David has
55:15
Speaker A
different ways of entering it. Um I think you know his ways com with the addition of uh Taylor makes it the perfect entry level and that's why he's successful at it.
55:32
Speaker A
Yeah. I think uh you know to expand upon that uh for David is you know what we want to do with the tailor it's it's not an execution methodology.
55:42
Speaker A
um you know what you need to do is is uh take the ranges that the tailor uh projects the cycle projects and what what we're always trying to do on a day-to-day basis is handicap how far price has gone relative to an
56:00
Speaker A
observed range on a particular day and what is the potential on a particular day. uh you know cycle day one has a certain um expected uh action. Okay, cycle day two, same and the same with cycle day three. So once we're on those
56:20
Speaker A
particular days and we have a a broad idea of what we're at least expecting in the normal sense okay a day can be become an aberant day but in the normal sense what are we expecting and then how
56:35
Speaker A
far can price travel you know based upon you know that particular cycle date and then what we want to do is be able to uh make some uh judgment calls based upon, you know, whether prices have reached uh those
56:52
Speaker A
projected levels. And then at that point, it's not a matter of, okay, today we're just going to sell the high immediately on cycle day three. Uh we're going to look for we look for our intraday charts and look for signals
57:08
Speaker A
that show a shift. So, if today we were expecting um a high to be put in early in the day, all right, which of course it has been, we were looking for a reversal, which is how we traded it this morning for
57:23
Speaker A
everybody. At what point do we start um getting more aggressive to the short side and and rather than just sell it, you know, uh blindly because even on Taylor days on these cycles, the price can simply exceed these cycle targets
57:42
Speaker A
very easily at times and then eventually they they correct themselves. But you know, you may not be solvent enough to be holding on to a position, especially if you're of the day trading time frame.
57:54
Speaker A
If you're of the swing trading time frame, uh, another great way that that I know some folks how to use this is, uh, if you're an options trader, okay, uh, using, uh, weekly cycle, weekly options, uh, is a great way to position yourself,
58:11
Speaker A
uh, to essentially swing trade the cycles without, you know, having to uh, you know, worry about the intraday fluctuations as much. And but what you want to do is you want to look for uh when prices have reached the those
58:27
Speaker A
extremes. All right. And if you have the correct context. All right. So like yesterday was a great context once the price broke the cycle day low and pushed down and and hit those uh those 26s that we saw yesterday. Okay. Into the end of
58:44
Speaker A
the day and it started to rally. The context there was at that point in the day if you're using options for instance is to go buy a weekly option next Friday out all right at a relatively you know
58:56
Speaker A
low uh premium price all right and now today that premium price has obviously expanded up and then when now prices have reached uh near a projected target all right you could you could trade out of your options that's one way of
59:14
Speaker A
uh using the three-day cycle uh structure. All right. But in terms of you know intraday uh futures trading, what I what I like to do is stay in tune with the cycle and then look for reversal signals uh that you know uh
59:30
Speaker A
that would coincide with that point in in the cycle itself. All right. Um let's see what did man does that make sense everybody? Let's see. Uh Manford says, "It seems to me that the 3-day concept is more suited to swing trading in time
59:46
Speaker A
frames of several two to three days." Yeah. Um there's a lot of people, Manford, I I'll just take that question.
59:53
Speaker A
There's a lot of people there that I know that do a lot of uh swing trading, you know, using that type of uh this methodology. It is also conducive to those, you know, that day trade like like most of us. And it's staying on
60:06
Speaker A
that side of the market is is really important as well. That's all right. So in other words, when the market approaches the projected high as was the case today, then you look to short the moment the market starts to shy uh
60:20
Speaker A
market starts to shy away from the close to that projected high with a stop above that high. Yeah. So that's what kind of what we did today uh Dave as well is when we got up near that that high we
60:32
Speaker A
were starting to look for uh potential for reversals and then on our intraday charts we look for those signals such as we saw today on the premiums to uh to initiate a short position and then hold that you know to you know if you want to
60:48
Speaker A
hold it for the better part of the day or uh trade out of it for a short term and then re-enter it again there's several ways of the but again establishing yourself on the side of the uh cycle is you know at or near the
61:04
Speaker A
extreme targets if it reaches those uh reduces the the level of risk overall and knowing that there's a lot of professionals out there that trade this methodology okay um you know will will it can very much enhance um you know
61:23
Speaker A
your your overall returns and your performance Um, but again, you have to use it. It it takes a little bit of time to learn. All right? It's not something that it's a magic uh, you know, purple pill, but it
61:35
Speaker A
is um, it's certainly a way of giving you a template of how the market, you know, expands and contracts and it does so in a very rhythmic fashion. And again, these, you know, these projected uh levels, uh, many professionals know.
61:55
Speaker A
So, you know, the old adage goes, you know, it's a self-fulfilling prophecy. Well, if there's a lot of big professionals, you know, quote unquote, smart money out there that are using, you know, techniques like this, then I think it's important for the um, you
62:08
Speaker A
know, relatively, you know, smaller retail type trader, uh, to have this type of knowledge. And and that's you know one of the key reasons why we're uh you know we're bringing this forth uh as we're doing it uh you know today between
62:22
Speaker A
the last two uh workshops. Okay. Any other questions? Uh okay re had a question. I was wondering what assumptions could be made regarding options at or near the end of the day two week. Okay. So, I I think I answered
62:42
Speaker A
that already, Re. I'm not sure if you heard me. Okay, you did. Okay, great.
62:47
Speaker A
All right. And then somebody mentioned something about the oil projections today. So, basically, this was the projection today for oil and it went right across all all numbers and but we're closing at or we're getting ready to close at all these normal levels. So,
63:09
Speaker A
we just peaked a little bit above, but we're we're around there. Okay. Uh Rich, let me take the screen back and um I'm I'm going to project my uh screen here.
63:28
Speaker A
Okay, everybody should see my uh 3-day cycle screen on the website. Okay, great. Um, all right. So, uh, we had a question about where can we get access to the, uh, 3-day cycle, uh, electronic book, spreadsheet, and so
63:44
Speaker A
forth. So, um, on our the the website here, um, under the trading tab, okay, look for the 3-day cycle and it'll bring you to this landing page and it'll explain to you a little bit about the three-day cycle, okay? Um and then there is if you
64:02
Speaker A
click on where it says click here there's a um a link to the 3-day cycle uh document. All right, which will give you you know everything that we've discussed somewhat here and in the and in the prior workshop uh a little bit
64:15
Speaker A
further down the page. Okay, what I recommend is there's a recording of our part one. This is part two today. So take a look at that. And if you want to subscribe to the ebook, all right, just click on the subscription button here,
64:28
Speaker A
the subscribe, that'll bring you to the subscriptions page. And again, a little bit more detail there. And uh the subscriptions that Rich offers on his electronic uh ebook versions uh are five and they contain the uh ES futures and
64:44
Speaker A
indexes, European futures. So, for those of you that trade, you know, over there in that that time zone, uh, gold, silver, and energy products is a popular one. All right. As well, um, not sure how many people here trade forex
64:57
Speaker A
futures, but it's available. I know some people were talking about the Euro dollar, uh, and and some of the interest rates, but the I think uh, the main products that are most popular anyways are the e- minis and the uh, energy
65:09
Speaker A
products out there. So, just um, uh, click on that, subscribe. It is a separate subscription. All right. So, uh, um, right there. And what Rich will do is we'll get your, uh, email information. It's emailed out to, uh,
65:25
Speaker A
his subscribers, uh, each day at a little bit no later than 5:00 p.m. Eastern time, uh, usually. And, uh, again, Rich is over in Europe, so there's a a big six hour difference there. And he's he's spends uh, each
65:38
Speaker A
evening up late, you know, to get that out to a subscriber. So, uh, that's the way to get access to the ebook. And uh and again uh we're here to help support everybody uh learning how to do it. I
65:49
Speaker A
speak of it every day and in the daily trade strategy. Uh we talk about it uh you know throughout the course of uh the day during the trading session. And of course uh if anybody has questions about the uh you know spreadsheet directly. Uh
66:06
Speaker A
I'm sure Rich would be happy to take um you know uh support questions or anything that you know needs to uh you can probably contact him or myself directly via you know email. All right.
66:17
Speaker A
So if there's uh no further questions um you know again the just some of the final comments that I want I wanted to make and uh and we want to thank Rich for his attend for his presentation today is very informative. Um but again
66:31
Speaker A
you know the bottom line is that you know this is a three-day cycle pattern i.e. the tail of that, you know, it's been utilized for many years by some of the largest mutual funds and hedge funds. All right. Um again, you know,
66:43
Speaker A
people call them the smart money. They manage trillions of dollars. All right. So, you know, collectively their buying and selling patterns, all right, are very important in how the market, you know, moves around, how they act. And you know as a retail type trader you
67:01
Speaker A
know uh the small type of guy um we're always you know in a sense you know we're always seem to be disadvantaged to a degree right well my background from the investment banks you know I've been on that side of the equation for many
67:15
Speaker A
years so this is a technique all right that uh if you eng engage yourself and immerse yourself in learning a technique that professionals use all right it can help give you you know a a welldeserved well required edge. All right, again
67:34
Speaker A
it's not the magic pill but it is a very important part of understanding the functionality of the market and then with uh Rich's guidance and my guidance um you know it will help uh certainly give you guys an edge. All right. And
67:48
Speaker A
again, if if anybody's interested, you can contact myself and uh and then if you need to contact Rich, we'll uh we'll we'll get your uh uh get you hooked up with Rich directly. Um but that's the way uh you can uh get access to the
68:02
Speaker A
spreadsheet, the electronic book. Again, we use it every day. All right. And I think that's it. Is anybody other questions? We can conclude here.
68:12
Speaker A
Well, I'd like to thank you, David, for inviting me to this webinar and I was glad to be here and I hope it was I was able to help answer a lot of the questions. Okay, great. Got one last
68:24
Speaker A
question here. Um, is the kit worth trying uh to wade through the Taylor's book?
68:32
Speaker A
So, I think David Gabriel here um had read Taylor's book once before. Rich, uh, you may want to just mention, uh, here at the end about what your experience was when you originally read the Taylor book. Uh, I know David said
68:48
Speaker A
he found it difficult, and I think you did as well. I think the Taylor book must have been the hardest book I've ever read in my life. Um, chapter three or no, I'm sorry, two to four. Uh, is
69:03
Speaker A
where the calculations and all this is done. and it's so badly written it it's terrible to understand. Then you have to match it and then after that you read what he's explaining for each day. And the only way I managed to figure out
69:17
Speaker A
what he was trying to say was basically read between the lines and ex and exaggerate what he was saying. I mean when he said well there's violation on certain day why why only one day there's a violation on every day possible.
69:30
Speaker A
There's penetration only on one day. Who cares? There's penetration on every day. So that's why my system is different than his. I can understand why he was doing it that way. I mean, he didn't have a computer, so he had to do
69:43
Speaker A
everything by hand. And when he was uh looking at his little paper book, he would try to eyeball and say, "Well, okay, that looks like what we should be expecting today." uh in my case, I mean, yeah, we got Excel, we make uh
69:58
Speaker A
spreadsheets and we just average out, you know, eight years worth of data instead of just looking at the little book that has four or five days worth of data in it or, you know, two weeks or three weeks worth of data. So it's it's
70:14
Speaker A
different and that's why I invent eventually ended up having to um um to make a 20 day or 20 cycle average just to compare what's happening recently and not only for the whole eight years. Uh somebody saying I should
70:32
Speaker A
rewrite the book. Yes, when you subscribe to the thing, you do get a my version of the rewritten book, which instead of being a 100 pages is only about 20 some odd or 30 pages, I forgot how many pages. And it's written in u
70:47
Speaker A
plain ordinary English and not Taylor English, which I still don't understand how he writes, but anyway, he's very tough to understand.
70:58
Speaker A
All right, great. Well, thank you very much, Rich, once again. uh it's it's very informative and uh I always learned something myself and I've learned quite a number of things myself today. So um we'll uh end the conclude the workshop
71:11
Speaker A
here today. Thank you very much everybody. It is recorded. Uh we will have it hopefully uploaded loaded to the website um by the weekend and get copies out to everybody that uh that registered. And again, thank you very
71:24
Speaker A
much and enjoy the rest of your day and uh and and happy trading. All right.
71:29
Speaker A
Thanks again, Rich. Okay, thank you. Bye-bye.
Topics:3-day cycleTaylor trading techniquefutures tradingsupport and resistancesmart moneyPolaris Trading Groupebook spreadsheetDouglas Taylorswing tradingmarket cycles

Get More with the SozAI App

Transcribe recordings, audio files, and YouTube videos — with AI summaries and speaker detection. 30 minutes free.

Or transcribe another YouTube video here →