Learn how SMT divergence between the S&P 500 and NASDAQ helps predict trend changes and improve trading decisions.
Ask about this video. Answers come from its transcript only — with the timestamp, so you can check them.
Generated from the transcript and can be wrong — check the timestamp.
Key Takeaways
- SMT divergence compares S&P 500 and NASDAQ price action to predict trend changes.
- It is most useful during liquidity sweeps where orders are filled.
- Bearish and bullish divergences signal potential reversals in market direction.
- Traders can gain higher risk-reward setups by using SMT divergence signals.
- Context and timing are critical for the effectiveness of SMT divergence.
What the video covers
- SMT divergence involves comparing price movements between the S&P 500 (ES) and NASDAQ indexes to identify potential trend reversals.
- The video explains how divergences form when one index makes a lower high while the other makes a higher high, signaling possible market direction changes.
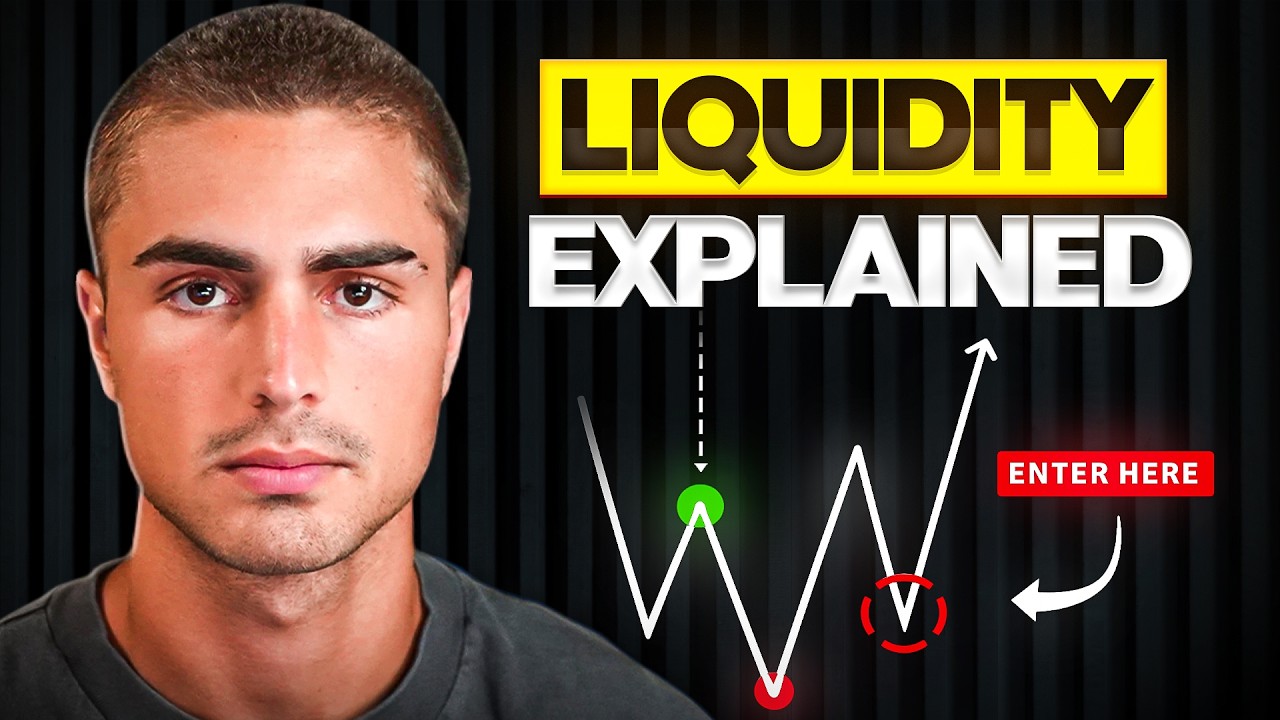
- SMT divergence is most effective when it occurs around significant liquidity draws and order sweeps, which indicate filled orders and potential reversals.
- The correlation between the S&P 500 and NASDAQ allows traders to anticipate future moves of one index by analyzing divergences with the other.
- Bearish SMT divergence occurs when the S&P 500 shows weakness with lower highs while NASDAQ continues higher, suggesting a downward trend is imminent.
- Bullish SMT divergence is the opposite, where the S&P 500 signals strength and NASDAQ confirms with higher highs, indicating an upward trend.
- The video emphasizes the importance of context and timing, noting that SMT divergences outside liquidity sweeps may be less reliable.
- Examples on daily and hourly charts are used to illustrate how SMT divergence can provide higher risk-reward trading opportunities.
- The presenter admits uncertainty about the exact meaning of 'SMT' but focuses on practical application of divergence concepts.
- Understanding SMT divergence helps traders better anticipate market moves and improve entry and exit timing.
Chapters
- 00:00Introduction to SMT Divergence
- 00:56Forming SMT Divergence Explained
- 01:49Trend Change and Break of Structure
- 02:49Using Both Indexes to Identify Divergence
- 03:40Understanding Divergence Meaning
- 04:31Liquidity Draw and Order Filling
- 05:28Bearish SMT Divergence Example
- 06:20Correlation Between NASDAQ and S&P 500
- 07:07Bullish SMT Divergence Example
- 09:54When SMT Divergence is Most Useful
Full Transcript — Download SRT & Markdown
Speaker A
All right, guys. Let's get into this. Welcome to SMT Divergence Explained.
Speaker A
NASDAQ. And we literally are forming one right now. So, again, it involves looking at two different instruments.
Speaker A
So, for the Forex and Commodities people, unfortunately, this is not going to be as beneficial for you guys because this is specifically talking about the divergence between the S&P 500 and the NASDAQ.
Speaker A
able to see a break of structure or an inverse for value gap. And we know that we learned about those yesterday in the day in like a couple days ago for inverse for value gap and breakup structure. So an SMT divergence is
Speaker A
And we literally are forming one right now. So, again, it involves looking at two different instruments.
Speaker A
that being said, let's get into it. To be honest, I'm not going to sit here and [ __ ] you guys. I have no [ __ ] clue what SMT divergence stands for.
Speaker A
So, the S&P 500 and the NASDAQ at the same time. And then pretty much we're going to be comparing and contrasting their highs and lows.
Speaker A
Let's get into understanding it because this is actually what's beneficial. So let's say we have a high time frame high right here and we're going to split this down the middle. This is the S&P 500 chart, ES. And then this
Speaker A
And that will help us dictate whether or not one, the trend is going to change before even being able to see a break of structure or an inverse fair value gap.
Speaker A
that high and then we come down and then we make a lower high. So, what does that probably mean? it probably means, hey, orders have been filled and we're starting to change the direction to the downside. Now, if we look over onto the
Speaker A
And we know that we learned about those yesterday in the day, in like a couple days ago, for inverse fair value gap and break of structure.
Speaker A
able to capitalize on these small divergences that they have because they can tell us like literally the future about what the other one is going to do sometimes. So, if I get on here and I see boom, ES came up, swept out a high
Speaker A
So, an SMT divergence is actually using both the indexes, seeing a divergence between the two, and then that is going to help us identify if the trend is going to change, specifically when an SMT divergence is happening at a significant draw on liquidity.
Speaker A
sweeping out this high time frame high? What is ES telling us about NASDAQ on this? You're probably saying, "Well, I'm not sure. I don't really quite get it." Well, the S&P 500 swept out a high and made made a high and then made a lower
Speaker A
So, with that being said, let's get into it. To be honest, I'm not going to sit here and [ __ ] you guys. I have no [ __ ] clue what SMT divergence stands for.
Speaker A
over here and we see, okay, a high, this high was formed at the same time that this one was, but then this one forms a higher high at the same time that this lower high was getting formed. So, what
Speaker A
Smart money transfer divergence. I don't know. I don't care. All I know is that I know what a divergence means. I think it just means the difference. I think, okay, this is horrible, but whatever.
Speaker A
later on because if the S&P 500 continues this trend down what is going to happen to NASDAQ, NASDAQ is going to follow suit in turn potentially giving us a higher riskreward trade on NASDAQ or just in turn helping us be able to
Speaker A
Let's get into understanding it because this is actually what's beneficial. So, let's say we have a high time frame high right here, and we're going to split this down the middle. This is the S&P 500 chart, ES.
Speaker A
making a high, then a lower high, and NASDAQ making a high, then a higher high, instead of thinking, oh, we're in an uptrend on NASDAQ, we can look at the S&P 500, and we can say, oh [ __ ] this
Speaker A
And then this is the NASDAQ chart. Lit. Okay. So, we have a high time frame draw on liquidity right here. Or let's actually move this down a little bit. Boom.
Speaker A
to be NASDAQ. So when is this going to be useful? It's specifically going to be useful when we are actively sweeping out draws and liquidity. Why? Because this is where orders have the potential to get filled. Obviously, the S&P 500 and
Speaker A
And on the S&P 500 chart, we come up and we sweep out that high and then we come down and then we make a lower high.
Speaker A
outside of sweeping out draws and liquidity, these things will show up all the time and will be pretty much like useless to us. So let's get into identifying them on the on the chart. A bearish SMT divergence is when the S&P
Speaker A
So, what does that probably mean? It probably means, hey, orders have been filled and we're starting to change the direction to the downside.
Speaker A
then a higher high. This is a bearish confluence for both the indexes. So not only a bearish confluence for the S&P 500 because it's the leading index in the downward move because it's making a lower high but also it's a bearish
Speaker A
Now, if we look over onto the NASDAQ chart, we can see NASDAQ doesn't necessarily have to push above this high. Okay, the high on the NASDAQ chart.
Speaker A
bit quicker than NASDAQ at this point in time. You know, it could be for any reason, but what is it telling us that NASDAQ is going to do? It's going to go down. So, that's a bearish S& divergence. And again,
Speaker A
So, again, the NASDAQ and the S&P 500 are very correlated pairs. So, they trade very similarly. However, we are able to capitalize on these small divergences that they have because they can tell us, like, literally the future about what the other one is going to do sometimes.
Speaker A
made a high then a lower high while ES made a high then a higher high. What is NASDAQ telling us about the S&P 500?
Speaker A
So, if I get on here and I see boom, ES came up, swept out a high time frame drawing liquidity, we make a high, come down, make a lower high. But on NASDAQ, we come up, we make a high, and then we make a higher high.
Speaker A
But regardless, this is going to be a bearish confluence for both. Okay. Now, with that being said, let's go into the bullish S& divergence example. So, again, it can be on either of the indexes on the S&P 500. All that it's
Speaker A
What do we see here at the same time as we are sweeping out this high time frame high? What is ES telling us about NASDAQ on this?
Speaker A
What is that telling us? Again, especially when we're taking out a significant draw in liquidity. What is NASDAQ telling us about the S&P 500?
Speaker A
You're probably saying, "Well, I'm not sure. I don't really quite get it." Well, the S&P 500 swept out a high and made a high and then made a lower high, pretty much signaling that, yep, sell orders were able to get filled here.
Speaker A
low. So, regardless, what is this telling us about both of the indexes? Oops. What is that telling us about both of the indexes? NASDAQ, it wants to move higher. It's the leading index. The S&P 500, it is going to move higher. It's
Speaker A
And we are probably going to reverse off of this significant draw in liquidity where orders had the potential to get filled. Versus on NASDAQ, we look over here and we see, okay, a high, this high was formed at the same time that this one was, but then this one forms a higher high at the same time that this lower high was getting formed.
Speaker A
get on to the chart and let's show you real deal examples of this. Let me split this thing on up and let's see why my chart looks like this. Um, blue and black maybe.
Speaker A
So, what is the S&P 500 telling us about NASDAQ? [clears throat] One, that NASDAQ is the more bullish pair, but also it's helping us. ES is helping us be able to identify what's going to happen to NASDAQ a little bit later on because if the S&P 500 continues this trend down, what is going to happen to NASDAQ?
Speaker A
Okay, so we're on the daily time frame right here. Let's try and find an example on the daily time frame or I believe the 1 hour is going to be easier for us.
Speaker A
NASDAQ is going to follow suit, in turn potentially giving us a higher risk-reward trade on NASDAQ or just in turn helping us be able to identify the direction that NASDAQ is going to go because if we had just came up and made a higher high, we would still be under the assumption that, hey, we're still in an uptrend.
Speaker A
Oh, this was a good example. So, this was on the higher on a higher time frame, but you can still see it. So, boom, we have a high right here. And then boom, we have a lower high right
Speaker A
But now that we have the newfound knowledge of ES making a high, then a lower high, and NASDAQ making a high, then a higher high, instead of thinking, oh, we're in an uptrend on NASDAQ, we can look at the S&P 500, and we can say, oh [ __ ] this thing might actually go down.
Speaker A
So, NASDAQ, what did we do on NASDAQ? We came up and we swept out this significant draw on liquidity. This is actually on the 4 hour. So if we want to go here, boom, and then 4 hour here. So
Speaker A
So, that's just like a little example of what an SMT divergence is on the chart. Now, let's talk about identifying it.
Speaker A
what can we safely assume about both these indexes? One, the S&P 500 is the more bearish index. But two, we know that NASDAQ was able to sweep out orders and even though it made a higher high, we know that overall the price price is
Speaker A
So, again, let's put our line down here. This is going to be the S&P 500. This is going to be NASDAQ.
Speaker A
saying, okay, I'm probably going to want to take a trade on the S&P 500. Why would I want to take a trade on the S&P 500? Because it's the leading index.
Speaker A
So, when is this going to be useful? It's specifically going to be useful when we are actively sweeping out draws and liquidity.
Speaker A
right? I want to take it on the S&P 500, the one that's leading the move to the downside, the one that is actually making a lower high. Okay? And then on top of that, this is really going to be
Speaker A
Why? Because this is where orders have the potential to get filled. Obviously, the S&P 500 and NASDAQ are not going to perfectly align with each other and be perfectly correlated 24/7, 365.
Speaker A
out a high on NASDAQ, making a higher high, but us unable to sweep it on the S&P 500, making a lower high. And then what do we see price do on both the indexes following that? Boom, we dump
Speaker A
So, that's why it's very important that we have context here and understand that SMT divergences are very powerful when used when sweeping out draws and liquidity. However, outside of sweeping out draws and liquidity, these things will show up all the time and will be pretty much like useless to us.
Speaker A
See if we got anything on Friday. It looks like we did. It looks like we did. It looks like we did.
Speaker A
So, let's get into identifying them on the chart. A bearish SMT divergence is when the S&P 500 makes a high and then a lower high. Doesn't matter which chart this is on.
Speaker A
Thursday. Thursday. Thursday. 9:30. Okay. Let's look on Thursday. 9:30. Okay. Yeah. I mean, this there wasn't like a actual like strategy entry, but this is a good example of how you could look for a entry or potentially use it as a confluence. So
Speaker A
So, it just is when one of the indexes makes a high then a lower high and then the other index makes a high then a higher high.
Speaker A
a higher low. If we look at the same time that this low was formed right here on the S&P 500, we have this low, and then when this higher low was formed, we look over to that same point on NASDAQ.
Speaker A
This is a bearish confluence for both the indexes. So, not only a bearish confluence for the S&P 500 because it's the leading index in the downward move because it's making a lower high, but also it's a bearish confluence for the lagging index.
Speaker A
show up on every single time frame, but this is a good example of how look right here. What are we doing while this is happening? We're actively sweeping out high time frame draws and liquidity right here. So, again, this very well,
Speaker A
Why is it lagging? Because it's continuing the uptrend while ES is forming a new downtrend.
Speaker A
Because it's the more bullish index, right? This is a bullish SMT. I want to be taking the trade on the index that is leading the charge and not the one that's behind, right? That's still forming the downtrend. I want to be the
Speaker A
So, this one's lagging behind ES because ES was able to fill probably more orders and is able to move a little bit quicker than NASDAQ at this point in time.
Speaker A
So, I get on here, I see awesome like this can be a quick breakdown. We come down, we sweep out a high time frame draw on liquidity. Awesome. We see a low and then we see another low get for
Speaker A
You know, it could be for any reason, but what is it telling us that NASDAQ is going to do? It's going to go down.
Speaker A
confluence for the S&P 500 and a bullish confluence for NASDAQ. And look, this is a prime time example. If we look at the S&P 500 compared to NASDAQ, the S&P 500 again is the leading index. We can see a
Speaker A
So, that's a bearish SMT divergence. And again, these two charts can be changed. So, the S&P 500 can be the one that's making a higher high and NASDAQ can be the one that's making a lower high.
Speaker A
just showing examples of why we want to take the leading index rather than the lagging index. So hopefully I mean this was really all that we needed to cover.
Speaker A
Again, if we look at the chart and we see, oh, NASDAQ made a high then a lower high while ES made a high then a higher high, what is NASDAQ telling us about the S&P 500?
Speaker A
little bit more as we start introducing it in trade recaps um and as you guys start seeing me put it together with our strategy videos. But right now I want you guys to be able to at least identify
Speaker A
It's telling us that, hey, NASDAQ is the leading index. We probably filled orders above this drawn liquidity that we just swept out and now we're forming a downtrend and ES is the lagging index.
Speaker A
theory and then I think it's going to be time for us to be able to put all of our confluences together because we pretty much learned every single confluence that we need in order for us to be able
Speaker A
But regardless, this is going to be a bearish confluence for both. Okay.
Speaker A
than that, we're on a very, very good track here. So, love and appreciate you boys. I'll see you guys tomorrow.
Topics:SMT divergenceS&P 500NASDAQtrading strategymarket divergenceliquidity sweeporder flowtechnical analysisrisk rewardtrend reversal