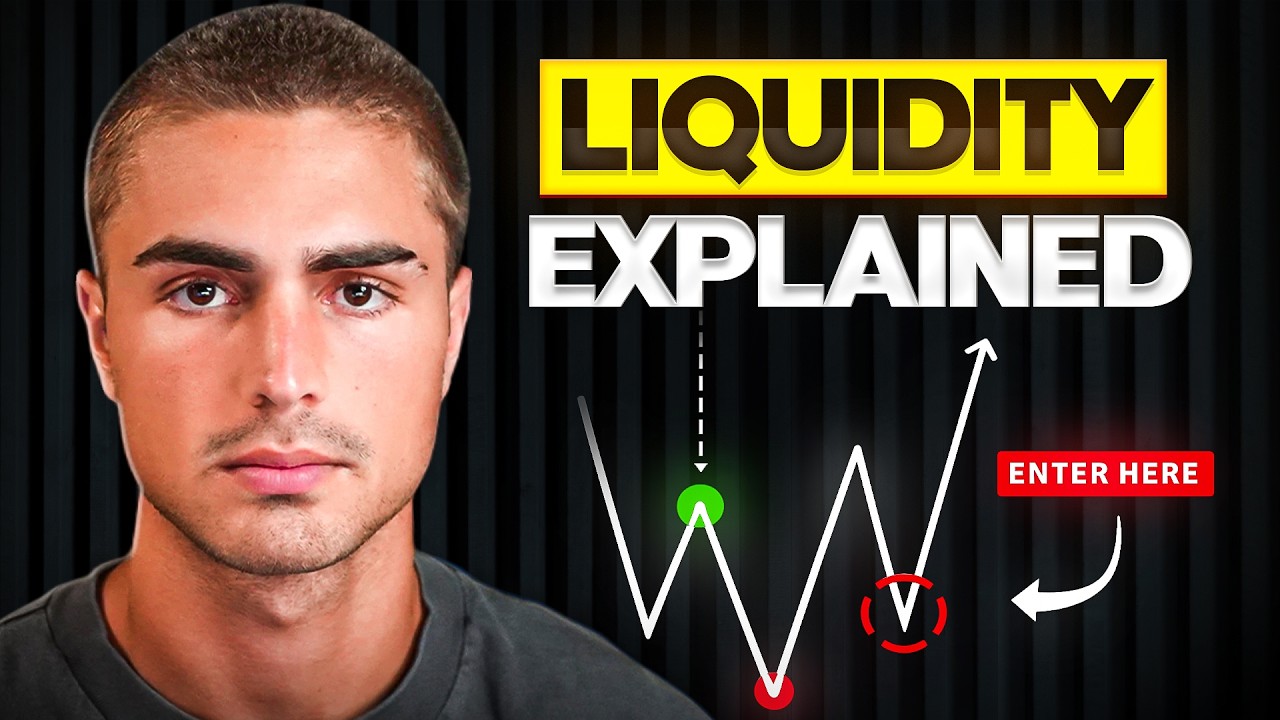
TJR explains equilibrium as a continuation confluence in trading, showing how to identify premium and discount price ranges to predict trend continuation.
Ask about this video. Answers come from its transcript only — with the timestamp, so you can check them.
Generated from the transcript and can be wrong — check the timestamp.
Key Takeaways
- Equilibrium identifies premium and discount zones to spot continuation opportunities in trends.
- Properly marking equilibrium from recent swing lows to highs is crucial for accurate analysis.
- Market makers use equilibrium zones to fill orders and drive price movements.
- Equilibrium should be used alongside liquidity and fair value gaps for confirmation.
- Misunderstanding equilibrium leads to common trading errors; simplicity does not mean it should be ignored.
What the video covers
- Equilibrium is a continuation confluence that helps traders identify opportunities to continue a trend.
- It distinguishes between premium and discount price ranges within the current trend.
- TJR uses a GAN box tool to mark equilibrium, focusing on the 50% midpoint between the most recent swing low and high.
- In an uptrend, equilibrium helps identify discounted price ranges where buy orders accumulate before price moves higher.
- Market makers use equilibrium to fill orders and push price in the direction of the trend.
- The video emphasizes the importance of marking equilibrium correctly to avoid trading mistakes.
- Liquidity and fair value gaps are also discussed as complementary confluences for confirming trend continuation.
- Examples are provided on how to draw equilibrium from the most recent swing low to high and vice versa.
- The concept is shown to be simple but often misunderstood or misapplied by traders.
- Correct context and combining equilibrium with other confluences are necessary for effective trading decisions.
Chapters
- 00:00Introduction to Equilibrium and Continuation Confluences
- 01:06Common Mistakes in Marking Equilibrium
- 01:59What is Equilibrium and Its Benefits
- 02:51Using GAN Box to Identify Equilibrium
- 03:40Understanding Premium and Discount Price Ranges
- 04:17How Market Makers Use Equilibrium Zones
- 07:15Inverse Fair Value Gap and Liquidity Concepts
- 09:56Correctly Drawing Equilibrium and Practical Examples
- 14:04Summary and Importance of Context in Using Equilibrium
Full Transcript — Download SRT & Markdown
Speaker A
What up? Let's get into equilibrium explained. This is going to be another one of our continuation confluences.
Speaker A
seem to mark out equilibrium incorrectly. So, I'm going to make an attempt. I'm trying I'm going to try not to blow my brains out be just thinking about some people and some examples that I've seen of people marking out
Speaker A
Okay, this is probably the easiest confluence to grasp. Yet somehow, I don't understand it. I literally don't understand how you guys still
Speaker A
What is equilibrium and why is it beneficial for us? It's a continuation confluence. So, what does it show us? It shows us the opportunity to continue a trend. Okay, equilibrium. I like to use a GAN box to be able to to determine it. All that
Speaker A
seem to mark out equilibrium incorrectly. So, I'm going to make an attempt. I'm trying. I'm going to try not to blow my brains out just thinking about some people and some examples that I've seen of people marking out
Speaker A
So, let's say that we are in a uptrend. Let me get rid of this GAN box for a second. I'll show you guys my settings on that as well so you guys can copy it.
Speaker A
equilibrium in the past, but it's so [ __ ] easy. Don't [ __ ] it up and just listen to what I'm saying.
Speaker A
Right now, what are we currently in? We are currently in a premium, right? when we're in an uptrend, when we finish our extension, we are going to be in an in a premium. So, what equilibrium allows us to do is it helps us identify the
Speaker A
What is equilibrium and why is it beneficial for us? It's a continuation confluence. So, what does it show us? It shows us the opportunity to continue a trend.
Speaker A
above this line, which is equilibrium because down here is a discounted price range with from this swing low up to this swing high and up here is a premium price range from this swing low to this swing high. Now again, let's think about
Speaker A
Okay, equilibrium. I like to use a GAN box to be able to determine it. All that equilibrium is, all that the definition of equilibrium helps us identify premium and discount ranges within the current trend that we are in.
Speaker A
price into a discounted price range and then they're going to buy up all the shares to be able to push price higher.
Speaker A
So, let's say that we are in an uptrend. Let me get rid of this GAN box for a second. I'll show you guys my settings on that as well so you guys can copy it.
Speaker A
discounted price range for longs. What do we want to look for? We want to look for potential buys. And the market makers want to do the same. This is a very very simple confluence. All that it does is it identifies the 50% mark from
Speaker A
But let's say that we are in an uptrend, right? We have boom, a move up, then boom, a move down, boom, a move up.
Speaker A
discounted price range. Now we're trading back into a premium price range, we know that buy orders were filled underneath here. So price is probably going to continue the trend higher and push past this high. Okay. Now again, if
Speaker A
Right now, what are we currently in? We are currently in a premium, right? When we're in an uptrend, when we finish our extension, we are going to be in a premium.
Speaker A
Okay. Well, let's just walk through it. What confluences do we have? Well, we have liquidity, right? the opportunity for us to fill orders. So, if we're in an uptrend and then boom, we push above a draw on liquidity and then price says,
Speaker A
So, what equilibrium allows us to do is it helps us identify the premium and the discount of the current range that we are trading in. So in this case, if we are trying to take a buy position within this uptrend that we're in, it would be pretty ideal for us to not want to press buy anything
Speaker A
Inverse fair value gap. So, let's use this as an example. We end up inversing this fair value gap right here, showing us, hey, we have the opportunity to fill orders through liquidity. we get confirmation that we're filling those
Speaker A
above this line, which is equilibrium, because down here is a discounted price range from this swing low up to this swing high, and up here is a premium price range from this swing low to this swing high.
Speaker A
up, fill a discounted price range, and then move down out of that discounted price range. Awesome. We can take shorts off of that. Why? Because we had the the opportunity to fill orders. We confirmed that orders were filled through a
Speaker A
Now again, let's think about the market makers again because that's who we're trying to trade like. That's who we're trying to trade with. Are they going to be looking to top blast their own positions up here and take longs right there? No. They want to push
Speaker A
Beautiful beautiful beautiful beautiful. Okay, so again, how do we mark out equilibrium? It is very simple.
Speaker A
price into a discounted price range and then they're going to buy up all the shares to be able to push price higher.
Speaker A
Because this is where every [ __ ] idiot [ __ ] this [ __ ] up and it pisses me off.
Speaker A
So in this case, right, as we see price coming down, do we want to be bidding this? Do we want to be bidding this? No. No. No. No. No. Boom. We push past equilibrium. Now we're in a
Speaker A
The most recent low to the most recent high. If there's a low right here that's connected to this high, do we draw equilibrium from this low up to this high?
Speaker A
discounted price range for longs. What do we want to look for? We want to look for potential buys. And the market makers want to do the same. This is a very, very simple confluence. All that it does is it identifies the 50% mark from
Speaker A
So, if we are in an uptrend and we have this boom, what do we take it from? We take it from the most recent low up to the most recent high that was formed.
Speaker A
the most recent swing low up to the most recent swing high within a trend as a continuation confluence. And once we push underneath equilibrium and then we can get some bullish confluences out of it, we can say awesome, we pushed into a
Speaker A
No, we don't. AND AND YOU'RE PROBABLY SAYING, "YEAH, TJR, LET'S GET TO THE CHARTS. YOU GUYS ARE IDIOTS SOMETIMES.
Speaker A
discounted price range. Now we're trading back into a premium price range, we know that buy orders were filled underneath here. So price is probably going to continue the trend higher and push past this high.
Speaker A
Where's the low? It's this one. Up to the most recent high. Awesome. That's how we market. Is it from this low to this high?
Speaker A
Okay. Now again, if we think about our strategy and we think about when we put all of these things together, how is this beneficial to us?
Speaker A
from this high down to this low? No. We take it from the most recent high down to the most recent low.
Speaker A
Okay. Well, let's just walk through it. What confluences do we have? Well, we have liquidity, right? The opportunity for us to fill orders. So, if we're in an uptrend and then boom, we push above a draw on liquidity and then price says,
Speaker A
case, the premium is actually the the discount because the premium we want to be trading into a premium so that we can take shorts because we want price to go lower. Okay? But we take it from the most recent high down to the most recent
Speaker A
"Hey, I'm going to take this opportunity. What am I going to do? What did we learn yesterday?" Awesome.
Speaker A
We can show you guys this happening on the weekly time frame. Okay. So, let's see here. From this most recent low up to this most recent high, what do we do?
Speaker A
Inverse fair value gap. So, let's use this as an example. We end up inversing this fair value gap right here, showing us, hey, we have the opportunity to fill orders through liquidity. We get confirmation that we're filling those
Speaker A
Let's show another example of it. Let's see right here. Do we push into equilibrium? Oh, would you look at that? We do. from the most recent low up to the most recent high.
Speaker A
orders because we are not continuing the uptrend by inversing this fair value gap. Then from there, what can we look for as a potential continuation confluence? Either a fair value gap or equilibrium. Now price is able to come
Speaker A
above this high. Again, this confluence is completely and utterly useless to you guys if it is not used with correct context. Okay, let's show let's show a good example of like kind of us slowly but surely forming these things all into
Speaker A
up, fill a discounted price range, and then move down out of that discounted price range. Awesome. We can take shorts off of that. Why? Because we had the opportunity to fill orders. We confirmed that orders were filled through a
Speaker A
from there. What can we see? Well, we get an inverse for value gap. Awesome.
Speaker A
confirmation confluence and then we're waiting for a continuation of the current trend that is forming.
Speaker A
From there what can we look for? We can either look for boom a fair value gap a bullish for value gap that gets filled.
Speaker A
Beautiful, beautiful, beautiful, beautiful. Okay, so again, how do we mark out equilibrium? It is very simple.
Speaker A
Let's see if equilibrium was filled from this low up to this this high. It wasn't. All good. Let's see if equilibrium was filled from this low up to this high. Awesome. It was. Price comes down, pokes its head underneath
Speaker A
When we are in an uptrend, we take it from the most recent low. Listen to me.
Speaker A
Okay. So, right here, what do we do? We inverse this gap. So, we know that we are in a bearish trend. Let's see if we hit equilibrium. We take it from the most recent high down to the most recent
Speaker A
Because this is where every [ __ ] idiot [ __ ] this [ __ ] up and it pisses me off.
Speaker A
most recent high down to this most recent low. And we can see both of our continuation confluences working in tandem here. What do we have? We have a fair value gap and we have equilibrium.
Speaker A
It pisses me off. So, listen. It literally makes me want to punch a hole through my screen. How it's the easiest confluence on earth.
Speaker A
Beautiful. Beautiful. This should be very freaking easy for you guys to do and for you guys to look at. Okay. Um I mean that we can we can do this [ __ ] all freaking day long. Um, we can take it
Speaker A
The most recent low to the most recent high. If there's a low right here that's connected to this high, do we draw equilibrium from this low up to this high?
Speaker A
Okay? Like it's it's literally that simple. It's literally that easy. And it's a very useful confluence to show us a continuation of the trend. We can show it on every single time frame. Um, just like with all of our other confluences,
Speaker A
No. No. No, we don't. We draw it from the most recent low up to the most recent high. Okay.
Speaker A
So again, up to the high, down to the low. What do we do? We come up, we fill equilibrium, and then we continue lower.
Speaker A
So, if we are in an uptrend and we have this boom, what do we take it from? We take it from the most recent low up to the most recent high that was formed.
Speaker A
that this was going to be a downtrend? We saw a break of structure to the downside right here. Awesome. We see breaker structure to the downside. We see price come up, fill a fair value gap, fill equilibrium, and then price
Speaker A
Okay. If we do something like this, do we take it from this low up to this high?
Speaker A
like this, okay? Taking it from this high down to this low. Why is this incorrect? You're stupid. Because this is the most recent high down to this most recent low. Okay. And I guess I should have put more more context here.
Speaker A
No, we don't. And you're probably saying, "Yeah, TJR, let's get to the charts. You guys are idiots sometimes.
Speaker A
Right here. Okay, because you're probably saying, "WELL, THERE'S OTHER HIGHS and lows over here." Okay, idiots. I'm talking to you guys uh as if we're in this real time, right?
Speaker A
You guys are such freaking idiots sometimes that this is actually an issue." I'm sorry. I love you guys. I'm trying to teach you. But holy crap, the most recent low. So, where's the most recent low? It's this one.
Speaker A
Because we are putting this on as the retrace is forming, right? So, we have the most recent high. Boom. We put an up candle in. And now this is the most recent low. Boom. We strap on the GAN
Speaker A
Where's the low? It's this one. Up to the most recent high. Awesome. That's how we mark it. Is it from this low to this high?
Speaker A
Awesome. Price is probably going to move lower. Beautiful. Beautiful. Beautiful. Okay. Now, if we want to draw out equilibrium, what are we going to be waiting for on this next candlestick? We need to wait for an up candle, right?
Speaker A
No, it's the most recent low to the most recent high. Okay. You're literally just following the trend. Okay. And then for a downtrend, it's from the most recent high down to the most recent low. So if this is our downtrend, do we take it
Speaker A
recent low. Unfortunately, in this case, we don't fill equilibrium. But what do we end up doing? We end up filling our other continuation confluence, and then we end up moving lower. Okay, it's it's really that easy. You just
Speaker A
from this high down to this low? No. We take it from the most recent high down to the most recent low.
Speaker A
That being said, I love and appreciate you guys. Let's get into SMT divergences. This one might melt your brains a little bit tomorrow. So, strap in. Be ready to learn. Appreciate you, boys. I'll see you guys tomorrow.
Topics:equilibriumcontinuation confluenceGAN boxpremium price rangediscount price rangemarket makersliquidityfair value gaptrading strategytrend continuation