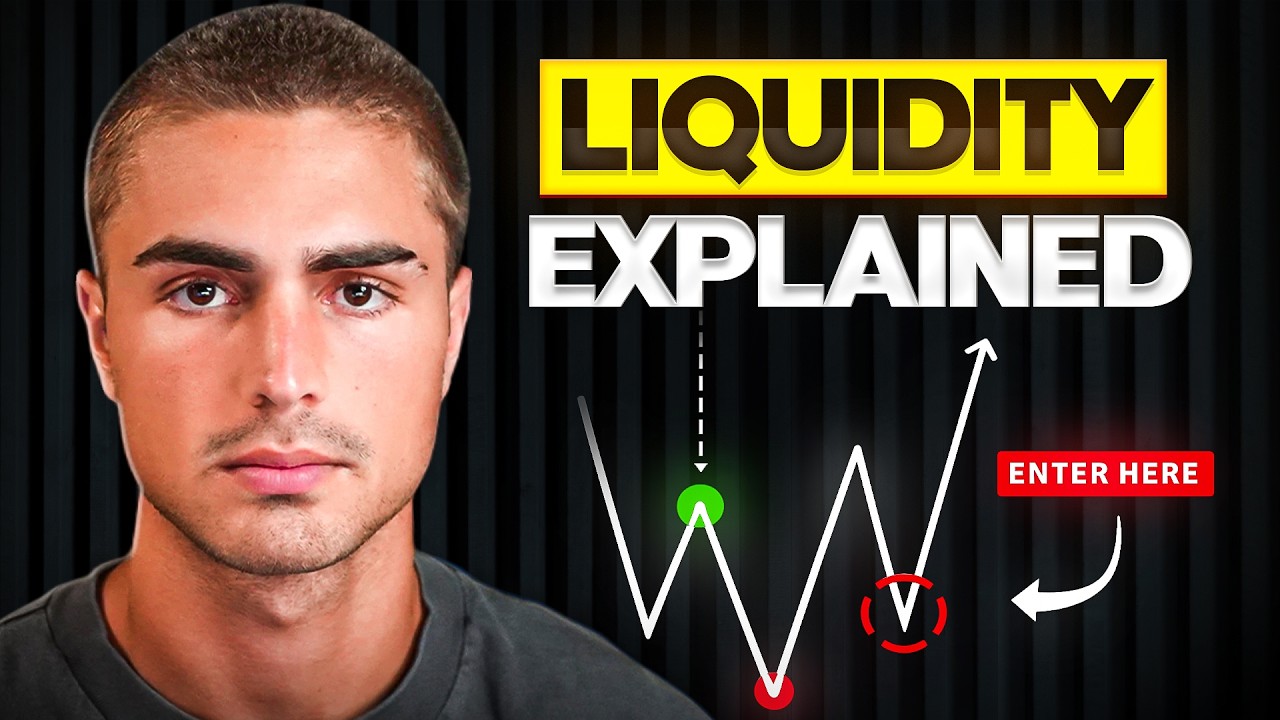
Learn how to find daily bias in trading, identify market trends, and use liquidity and fair value gaps for better trade entries.
Ask about this video. Answers come from its transcript only — with the timestamp, so you can check them.
Generated from the transcript and can be wrong — check the timestamp.
Key Takeaways
- Daily bias is essential to know market direction before entering trades.
- Draws and liquidity zones serve as critical areas for entries and targets.
- Fair value gaps and equilibrium points help identify retracement and continuation zones.
- High time frame trend analysis combined with lower time frame entries improves trade accuracy.
- Understanding order flow and liquidity sweeps aids in anticipating price moves.
What the video covers
- The video explains the importance of determining daily bias to understand market direction before entering trades.
- It covers identifying downtrends and uptrends using high time frame analysis and price structure.
- The concept of draws and liquidity as both entry points and targets in trading is discussed.
- Fair value gaps and equilibrium levels are introduced as key retracement confluences for trade setups.
- Examples from recent market days illustrate how to apply these concepts practically.
- The video emphasizes the role of liquidity sweeps and order flow in predicting price movements.
- It highlights the importance of recognizing manipulation and market structure breaks.
- Lower time frame analysis is used to refine entries and exits within the context of the daily bias.
- The presenter offers coaching opportunities for personalized guidance.
- Overall, the video aims to build a comprehensive approach to trading based on daily bias and market mechanics.
Chapters
- 00:00Introduction to Daily Bias
- 01:43Using Draws and Liquidity in Downtrends
- 03:45Fair Value Gaps and Equilibrium Explained
- 05:29High Time Frame Analysis and Liquidity Sweeps
- 07:03Order Flow and Market Manipulation Insights
- 08:42Lower Time Frame Entries and Trade Examples
- 11:45Summary and Coaching Invitation
- 30:51Closing Remarks and Final Thoughts
Full Transcript — Download SRT & Markdown
Speaker A
All right, guys. Welcome to our daily bias video. And in this, you guys are going to learn how to find daily bias. And then hopefully, we can kind of start putting together potential trade ideas in your guys' headspace. Um, and then
Speaker A
after this, I think we're going to cover some risk management, and then we'll finally put together how I am actually looking for entries. I want to cover daily bias first because without daily bias, you don't know where
Speaker A
the market's going to go. So, how are you going to be able to look for an entry or how are you going to look for an entry, right? And then if that's the case, then why the [ __ ] are we entering
Speaker A
in the first place if we don't know where the market wants to go, right? So, kind of difficult. Um, so let's get into daily bias. Let's get into daily bias. So, we'll go over today's trade. Today, um, there was a
Speaker A
pretty easy daily bias. Um, and this again is going to start combining all of the stuff that we have already learned thus far. So, let's look at the current market. What are we in? We are in an obvious downtrend, right? We are making
Speaker A
a high, then a low, lower high, lower low, lower high, lower low, lower high, lower low, lower high, and then that was pretty much leading us into market open.
Speaker A
So, what did we expect coming into market open? We were probably going to deliver a lower low. Now, also on top of that, why did we assume that we were going to deliver a lower low? We have all of this low resistance draws and
Speaker A
liquidity stacked up. We have a low right here, a low right here, a low right here, low right here, low, low, low, low, low. A whole bunch of lows all stacked up throughout here. Um, that can give us good entries for these shorts
Speaker A
within this downtrend, right? Because draws and liquidity can be used for several different things. Draws and liquidity can be used as entries, and it can also be used as targets. So going into today, give me one second. Let me
Speaker A
remove these. That was from us full porting CPI. So I don't want you guys to get confused. How do I? Let's go chart settings. Let's go trading. Let's go remove positions and orders. Nope. Let's go execution marks. So, okay, lit. All
Speaker A
right, cool. So, coming into today, my bias was bearish. Why? Because on the high time frame, we had a whole bunch of draws and liquidity to the downside. And on the high time frame, we were forming a downtrend. Okay, so on the hourly time
Speaker A
frame, we were coming into this hourly fair value gap. So, awesome. If this is going to continue being a downtrend, I am going to safely assume or we need to see price come into this fair value gap and respect it. If that gets respected,
Speaker A
where is price going to draw? Down to all of these high time frame, low resistance draws and liquidity. Today was about as easy as it gets, right? We identify what the high time frame is doing. Awesome. The high time frame
Speaker A
trend is in a downtrend. We see, okay, there's very awesome draws and liquidity to the downside that price could want to go down to target. And then from there, we look at current price action and we see, okay, we just made a high and we
Speaker A
just made a lower low. So, in turn, what is price going to need to do? It's going to retrace. And what is one of our two retrace confluences? Matter of fact, we can use both here. We use fair value
Speaker A
gaps and equilibrium. So, we see a fair value gap formed right here. Awesome. If this downtrend is going to hold, this fair value gap is going to get respected, and then we are going to target all of these lows. Let's say you didn't see
Speaker A
this massive fair value gap and you just wanted to look at equilibrium. Well, awesome. From this high down to this low, what else do we do? We come up, we fill the fair value gap, and on
Speaker A
top of that, we hit equilibrium and then we deliver lower to the draws and liquidity. So, that was a good example from today. Let's go and show some examples from yesterday. I'm going to, I want to leave my NASDAQ drawings on
Speaker A
there because I have a call with my blueprint students, which again, if you guys want to join the blueprint and you guys want extra help with coaching where it's like a little bit more direct, you guys can ask me your personal questions
Speaker A
on, um, what happened for you guys on the charts today. I'll leave a link down in the description for you guys to get coaching from me. So, let's look at this. So, if we can just drag this to
Speaker A
right here. Awesome. Let's look at the high time frames here. So, high time frame, what are we in? We are in an uptrend, believe it or not, right? We have a high, then we have a higher high. And you're
Speaker A
probably saying, "Oh, well, no, we made a lower low." Well, that is the case. We did make a lower low. However, this low is actually coming down and it's sweeping out this low right here. And on top of that, we are yet to break
Speaker A
structure to the downside. So in my opinion, right, especially coming into New York market open, we know that there's going to be some forms of manipulation. We can safely assume. And again, like this is happening, all of this happens before we're even looking
Speaker A
for a trade. So regardless, it's like, okay, we might be in a downtrend and then boom, this massive candle forms and it's like, okay, we're probably not in that downtrend anymore. So on the 1-hour time frame, what are we looking at here?
Speaker A
Well, we see that we come down, we sweep out a high time frame low. So awesome.
Speaker A
We get a high time frame liquidity sweep. So what do we know about this? We know that orders have been filled down here. Where does price need to go in order to get out of these orders? Right?
Speaker A
If we're buying low, where are we going to want to do? We're going to want to sell high. So, if we enter into a bunch of buy orders, where is there going to be a bunch of resting buy orders for
Speaker A
us to enter into sell orders to be able to liquidate this position right here, right? Because we got to think, we pushed underneath these lows. Why did we push underneath these lows? Because there were a lot of sell orders in order to fill
Speaker A
our buy orders. So, when we're going back higher and we're looking to get out of this position, we're looking where there's going to be a lot of buy orders where we can enter into sell orders to be able to get out of this buy order
Speaker A
position right here. Right? So, again, we're trying to use reverse psychology on the market. So, what do we see price do? We come up. Awesome. We form this big, big hourly candle to the upside. We're already in an uptrend. How can we
Speaker A
identify that? Well, we get an inverse of this hourly gap right here, and then we also get a 1-hour candlestick close to the upside. So again, we're not going to get into entries here, but I can show you on the 5-minute time frame
Speaker A
that even though we're forming a whole bunch of up candles, there is going to be a good enough, um, and good, good retraces or some continuation trade to be taken to be able to target these highs. Again, where does price need to
Speaker A
go in order to liquidate the buy orders from down here, right? They need to push it up above here to be able to take profit and to be able to exit out of those buy orders. So, if we just go and
Speaker A
play the rest of this candle or the next candle, we can see that the next couple candles end up pushing up and hitting full take profit or this draw on liquidity right here. If we go down to the lower time frame again, we can see
Speaker A
that there's plenty of opportunity within here. We see price retrace into a 5-minute fair value gap, right? There could have been longs off of that with stops underneath this candlestick. And then this could have been our take profit. Um, we could have even
Speaker A
gotten lower on the low time frames. We can see a low time frame 5-minute sweep of these lows right here. And then we would just be looking for a change of order flow for a break of structure to
Speaker A
the upside. Boom. Could have longed off of that. Stops underneath here. First take profit, second take profit. There's a whole bunch of different
Speaker A
daily bias. So, how did I come up with our our bullish daily bias today? Well, I looked and I see, okay, during pre-market, what did we do? We came down and we manipulated these lows. From there, we inversed this fair value gap
Speaker A
on the hourly time frame. So, what do I see? We're currently in a downtrend coming down. Then we sweep out a draw on liquidity where orders have the potential to get formed. And then boom, we disrespect this fair value gap, which
Speaker A
means to me, hey, we're probably no longer going to be in bearish price action. Because if we were going to be in bearish price action, we would have respected this gap and we would have continued lower to take out this low and
Speaker A
this low. But that's not what price did. What did price do? It closed above this gap, signaling to me, hey, price wants to go higher. We just invalidated this hourly gap. And if we wanted to go lower, we would have respected it to
Speaker A
push price down to these draws and draws and liquidity right here. That's not what happened. And then what does price end up doing? We know that we filled orders right here. We know that the low the high time frame trend got
Speaker A
invalidated right here. So where does price need to go to the next draw on liquidity right here.
Speaker A
All right, let's go and look at the next day. So this was Monday. Let's go ahead and let's look at some Friday price action.
Speaker A
All right, so let's look at this. This again is pretty clean price action. Okay, we see uh initially we're in a downtrend, right? We break structure to the downside right here. But then when do we break structure back to the upside
Speaker A
once we get a candlestick closure above this high right here. So boom, we are in a 4hour uptrend. If we go down to the hourly time frame, it's a little bit clearer for us, right? We can see the
Speaker A
4hour high is right here. We break above it. We come down, we continue higher, higher, higher. And on the one 1 hour time frame, we are in a very obvious and clear uptrend. So once again, I mean, it's it's very very obvious to
Speaker A
me that what is our draw on liquidity going to be? It's going to be these highs right here. Right now, why is that the case? Well, we are in an uptrend.
Speaker A
And right now, we are perfectly respecting the current hourly bullish order flow. We have a high right here.
Speaker A
Awesome. We have a low right here. We push past that high. We have a higher high right here. And then we have a higher low right here. And then from there, we push up, we make a higher high, and then we're about to form
Speaker A
another higher low. Now, coming into the market on this day, what am I going to be looking for? I'm going to be looking for some form of manipulation because we don't really get much manipulation. And as we know, if we we typically are going
Speaker A
to want to look for some sort of manipulation whether it's coming from London session, during Asian session, or come New York market open, we do have hourly manipulation right here. Um, but coming into the low time frames, we
Speaker A
we don't really have much. We have these equal lows right here. Do we invalidate this gap up here? No, we don't. So, me personally, I mean, it looks it looks okay. I would want to see how these next couple
Speaker A
candles close. So what we can do is we can play this. Can it print?
Speaker A
Okay. So again, well again, we're not we're not looking for entries just yet, but I see these equal lows. I want because New York market hasn't given us any form of manipulation yet. I'm going to be looking for some form of
Speaker A
manipulation whether it's 5minute manipulation or an hourly manipulation of these lows down here or again I mean we kind of get a sneak peek or hindsight of what price wanted to do down here. Um but we'll continue playing this and then
Speaker A
see where price goes from here. Okay. So boom, just like that. Okay, let's pause it. So, boom. Just like that. Can this not keep printing candlesticks? So, just like that, we end up coming down again. We know our
Speaker A
targets are these hourly highs all the way up here. But what do we need? We need to be able to fill orders in order to get up to these hourly highs. So, where do we have the potential to fill
Speaker A
orders? Underneath these lows and underneath these lows. Because what gives us the potential to fill orders?
Speaker A
Draws on liquidity. So, if we're looking to target these highs, just like we showed in the last example, how we had a liquidity sweep and then from there we could go up and target the highs. This is the same case, right? We need a
Speaker A
liquidity sweep to either take out these lows and these lows and in um the S&P 500's case to then be able to liquid to then be able to again fill orders down here, liquidate the orders up here, right? We're pushing underneath areas
Speaker A
where a lot of sell orders are going to get filled. And in that case, we're going to fill buy orders. And then price is going to end up going up to an area where there's going to be a lot of buy
Speaker A
orders so that we can enter into our sell orders and take profit on these positions that we're taking down here.
Speaker A
Okay. Now, again, we aren't going to be entering um on we aren't going to be smart enough to be able to press buy right underneath these lows. Um, however, we are going to be [clears throat] able to be able to catch
Speaker A
this move and to be able to target these highs. So, again, if we just play this a little bit more, there we go. We just got a 5minute break of structure to the upside. We just took out these highs. Awesome. Now, if we I
Speaker A
don't want to jump ahead, but if we look at the hourly candle, we can see boom, sweep down, orders filled, orders filled. And then if we go down to the 5minute, we can see boom, sweep down, orders filled, orders filled. Now, we
Speaker A
just broke five minute structure to the upside. Now, what am I going to be looking for? We see boom, orders got filled. We were initially in a downtrend. Now, we're in an uptrend.
Speaker A
What do I want to see following this? I want to see potential continuation so that we can go ahead and target these highs up here. So, we'll play this a little bit more. And this is just giving you guys like a little sneak peek of
Speaker A
potentially like the type of entries that we're looking for. Okay, so we get a little dogee candle.
Speaker A
Let's see if we get any sort of retracement into any of our confluences. We have a fair value gap right here.
Speaker A
Boom. We get a big push down. Now, again, just because we close underneath this gap doesn't mean that this entire uptrend is invalidated because we have another gap right here. Matter of fact, we have another gap down here. So, for
Speaker A
this entire trend to get invalidated, we would have to invalidate this gap down here. And actually, this is a gap that I would want to target because it's underneath equilibrium. And this is actually in a discounted price range
Speaker A
because again, we're looking to take longs in discounted price range. So, we'll see what price wants to do from here.
Speaker A
Boom. Awesome. We tapped into discounted price range and we pushed past this fair value gap. So, at this point in time, I'm seeing this and I'm saying, "Okay, lit. We just came down. We filled the fair value gap. We filled equilibrium.
Speaker A
From there, what am I going to be looking for? I'm finally going to be able to reposition my targets and look look for these highs.
Speaker A
And what do you freaking know? Take profit gets hit. I mean, as if the strategy wasn't given to you guys in this video. Hopefully, you guys are starting to get it now.
Speaker A
Again, what do we need in order to get up to these highs? Obviously, these highs are our draw on liquidity for the day, but we need orders, right? We need to sweep out liquidity in order to push to this draw on liquidity. How do we do
Speaker A
that? We get into the low time frame. We see price come down underneath these hourly lows, underneath these hourly lows. Awesome. We know that we have potential to fill orders here. How do we know that orders were filled? Well, we
Speaker A
get a break of structure to the upside on the 5minute. From there, what are we looking for? We're looking for a continuation of the new trend that is formed. So, what confluences can we use?
Speaker A
We can use our equilibrium confluence. We can use our fair value gap confluence. Awesome. In this case, we end up closing underneath this fair value gap. But that doesn't dis that doesn't disqualify this uptrend. Why?
Speaker A
because we still have equilibrium and we still have a fair value gap right here that could could have potentially been uh tapped into for us to be able to push higher. Price comes down, pokes into equilibrium and then as I told you guys,
Speaker A
we will from there look for price to move higher. What does price end up doing? Boom. Moves higher, takes out our drawn liquidity. Beautiful, beautiful, beautiful. Let's show one more example of this and then hopefully you guys will
Speaker A
have gotten the point. So, let's go ahead and put Oh, this was a super ugly day, but [clears throat] [snorts] uh because this was the day before FOMC. Let's do a different day.
Speaker A
Let's do 30. Okay, this one's a little bit difficult, but see what [snorts] we got going on here.
Speaker A
So, okay. So, on the 4hour time frame, what are we in? We are in a very obvious uptrend, right? We have these draws in liquidity over here. This this is super high up. I remember on this trading day, I
Speaker A
specifically was not super in favor of going long just because we had these super high draws and liquidity over here. But I mean, it is what it is. You kind of have to play with what you play with what you can get. Um, so boom. We
Speaker A
have these right here as well. Awesome. Awesome. Awesome. Okay, so on the 4hour time frame, what do we see? Okay, awesome. We are in an uptrend. We just came down, swept out this low, invalidated this gap. Now we have a
Speaker A
high, a low, higher high, higher low, higher high, making or forming a higher low with this action right here into this 4hour gap. So once we're filling this 4hour gap, what are we thinking?
Speaker A
Okay, price either can do one of two things. We can either come down, invalidate this gap, and then from there, what are we what are we going to be targeting? We're going to be targeting this low and this low because
Speaker A
we're invalidating the bullish continuation confluence for price to move higher. Okay. From there, how do we know that this bullish confluence was actually pushed into and respected?
Speaker A
Well, we start printing up like literally up only candles from the hourly time frame. From there, we end up getting an hourly breakup structure from us pushing above this hourly high right here. Okay. So, we see 4hour dip into
Speaker A
the 4hour fair value gap. How do we know that the 4hour fair value gap is respected? because we end up breaking one 1 hour structure out of that saying, "Hey, we're going to continue this higher." Now, from here, once we push
Speaker A
above that hourly gap, we can scale down to the low time frames and identify the current trend. So, we can see, awesome, we get the sweep. Awesome. We have a high, low, higher high, higher low, higher high, higher low. We just
Speaker A
finished making a higher high. So, what are we probably going to do? We're probably going to make a higher low. On top of that, on market open, what did we do? We manipulated these low time frame, low time frame lows. So, we already got
Speaker A
some form of manipulation. We could potentially grab a little bit more if we wanted to revisit these lows right here or potentially this low and this low over here. Okay, there's potential for that if we end up invalidating this gap
Speaker A
right here. So, we're already in a very key position, right? Because if price invalidates this gap, what then am I going to be targeting for the day? I'm going to be targeting this this low, this low, this low, right? even though
Speaker A
my bias is bullish. However, if we end up respecting this gap and then pushing higher, I can safely assume, hey, we're probably going to want to push higher and then I can go and try and find some lower high time frame highs that I can
Speaker A
use as like take profit points all the way through here because I'm not going to want to set this as my take as my one and only take profit all the way up there. Okay, so with that being said,
Speaker A
let's play this out. Let's see what happens. Boom. So, perfect. See, this is why we want to be patient. Awesome. we end up inversing this gap right here.
Speaker A
So, what do we know? Hey, we want to go lower. And unfortunately for us, when we inverse that gap, we end up taking out this low. However, we still have opportunity to go lower down to this low and this low. And then from there, you
Speaker A
know, maybe we can retarget retarget these highs. But what is a key position that we are going to want to be looking for? Just like how we had this gap right here. I'm going to be looking at now
Speaker A
this gap because again, if this is going to be bearish order flow after inversing that gap, what should price do? Price should technically come up, give us a retrace into equilibrium or into this fair value gap, and then from there give
Speaker A
us bearish confluences. If that's the case, awesome. We're going to go lower. However, if price comes up and then closes above this fair value gap, what can I safely assume? Price just wanted to come down, sweep out this liquidity
Speaker A
to then send it higher, right? There's lots of conditions with this. we kind we always are staying on top of it and looking at the the the trends of the markets and what current order flow we're in. So, let's play it and let's
Speaker A
see what price does. Okay, so we end up pushing pushing slightly lower here. Let's see if price is even able to give us an entry.
Speaker A
So, we were unable to get an entry there. However, we're in again another advantageous point. Why? because we just took out this draw in liquidity and now both of these draws in liquidity. So now we're in the same exact position that we
Speaker A
were in right here. Are we going to continue lower by respecting this gap or are we going to disrespect this gap and then are we going to be able to target all of these highs that are up here as
Speaker A
draws on liquidity? Well, personally, because this is our 4hour low, and if we are going to continue respecting this 4hour uptrend, which we just did on this bullish 4hour candle closure to the upside, I think that we are going to be
Speaker A
moving higher out of this out of this liquidity sweep, right? Because we're respecting high time frame uh continuation confluences right here. I don't really think that we're going to come up and then boom, destroy this low because we just used we
Speaker A
just had put this low in as a respecting point. So, I'm going to be looking at this inverse value gap. Honestly, looking for it to get invalidated. So, let's see.
Speaker A
Okay, we don't quite invalidate it just yet. Let's see what the next candle looks like.
Speaker A
Boom. Okay, so good at this. Boom. Price invalidates this. And then from there, to be honest, like I would be willing to enter into a buy position and then just go ahead and target this high right here and then whatever I would look on the
Speaker A
lower time frames and scroll all the way over here to look for other entry points. Um, and again, this is one of these later later entries where it happens a lot later in the day and price. Um, again, like some of these
Speaker A
trades again, we're just kind of like going over it and like mocking mocking [ __ ] up. Um, so we came up and took this out. Um, but hopefully you guys are getting getting the point. This isn't to cover
Speaker A
entries. This is to cover daily bias. Again, we are looking at the current draws and liquidity. And where price wants to go, right? We are in this case, we what were we in? We were in an uptrend on the 4 hour. We were pushing
Speaker A
into a fair value gap. So what do we expect price to do? We expect price to respect this fair value gap and push past these highs and take out other draws and liquidity over here. Because again, how does a trend move? It moves
Speaker A
from boom high. Okay. Down to fair value gap equilibrium. Then back up to what? High.
Speaker A
Then down into what? Fair value gap or equilibrium. Then back up to what? Highs. Okay, that's how uptrends move.
Speaker A
It moves from external to internal. External to internal. External to internal. Same thing with downtrends.
Speaker A
Okay, we move from boom internal to external, internal to external. Right? When we push into our bearish confluences, we are expecting to push down back to the lows.
Speaker A
When we push into bearish confluences and then we get bearish confirmation, we are expected to push down to the lows.
Speaker A
Okay? Same thing when we push back. When we push underneath these lows, what are we expecting price to do? Retrace into the internal, right, into our continuation confluences. That's the es and flows of the market. Okay, we go
Speaker A
from pushing underneath a low. Once that happens, hey, price is probably going to come up and fill a fair value gap or hit equilibrium. Once [snorts] price goes up and fills a fair value gap or hits equilibrium, hey, price is probably
Speaker A
going to want to come down and take it take this low out. It's the es and flows of the market. It's how the market moves. And hopefully that gave you guys a better idea of how we get how we can
Speaker A
establish daily bias coming into the market. We are really just looking for where where was our most recent liquidity sweep or are we currently sweeping liquidity. On top of that, what are our high time frame imbalances and equilibrium levels that we are looking
Speaker A
at within this current trend in the market. Let's do one more example where we don't necessarily go like full-fledged deep dive um but we can show Boom.
Speaker A
No. What did I do? Is that today? Oh, I'm an idiot. Okay, let's look at this real quick. So, boom, we'll go right here. Awesome. So, what do we see price doing before market opens? We see price come down. Oh my
Speaker A
goodness. We just broke hourly structure to the downside. At least that's what we're thinking at first, right? That's what we're thinking at first. We say, okay, if price is going to continue this downtrend, what does price need to do?
Speaker A
Well, price needs to come up and it needs to fill this fair value gap or it needs to hit equilibrium and then it needs to continue lower, right? Correct.
Speaker A
So, price makes this fair value gap. Price comes up and then we get a down candle right here. Did that hit this fair value gap? No. Did that hit equilibrium? No. Uh-oh. And then in turn, what does that do? That creates a
Speaker A
high. We get a move up and a move down. So now this is the high that price has to respect in order for us to continue this downtrend. This should be the lower high. What does the hourly time frame
Speaker A
end up doing? Boom. We rip up. We break structure to the upside. So what is that telling me? We are now in bullish order flow. So now I no longer give a [ __ ] about this for value gap right here. We
Speaker A
are in bullish order flow. And where do we need to target? Boom. These highs.
Speaker A
Now unfortunately price already came up and took care of business right there right when market opened. But we can see that this is uh this is like super super clean price action, right? If we go into the lower time frames, we have this high
Speaker A
time frame draw liquidity right here. We can see on the 5m minute, we come down, we sweep out this low right here. And then boom, we break structure to the upside. From there, we come into this 5minute fair value gap. Push down, push
Speaker A
up. Bullish confirmation that hey, the 5minut was previously in a downtrend. We break structure to the upside. Now we're respecting this new five-minute trend that we made. And where are we going to want to target? These highs right here
Speaker A
and the rest is history. We moved a lot higher than that. So that's another good example of us like literally just looking at the high time frame trends, identifying our continuation confluences and identifying our draws and liquidity and looking for price to either respect
Speaker A
it or disrespect it. And then in turn, we're able to develop a bias based off of that. Okay. On top of that, we're we're hopefully you guys have learned from this video, we're trying to look at our potential draws and liquidity as
Speaker A
well. So, not only, and I know I make it seem like a little bit easy, but not only am I looking and seeing, okay, price came down and we push underneath these lows, so now we're in a downtrend,
Speaker A
but uh-oh, we just broke structure to the upside. Once I see that breaking structure to the upside, what am I immediately doing? I'm immediately looking at what potential draws and liquidity do we have to the upside for price to go up and take out. I
Speaker A
immediately saw this high right here which is Asia session high and then I see this high right here which is previous day high. So we have two significant draws in liquidity to the upside.
Speaker A
Where is price going to want to draw towards those draws in liquidity? Why? Because we just broke structure to the upside right here. We are in an uptrend.
Speaker A
We come down. We fill equilibrium. Awesome. Then on the 5minute we see low time frame confirmation. We are going to want to long.
Speaker A
Beautiful, beautiful, beautiful. So, that wraps up our daily bias for today. Um, tomorrow I can't remember what we're covering. I think it's going to be risk management and then I think we're ready for some executions and how to actually put this [ __ ] to
Speaker A
work. So, that being said, love and appreciate you. Appreciate you, boys. I'll see you guys tomorrow.
Topics:daily biastrading strategyfair value gapliquidityorder flowmarket structuretrading entriesrisk managementtechnical analysistrade setups