Skip to content

Placer.ai Tutorial: Spatial.ai Demographics Overview

Tutorial on using Placer.ai and Spatial.ai for detailed demographic insights and marketing strategies at Kendall Yards Night Market.

Ask about this video. Answers come from its transcript only — with the timestamp, so you can check them.

Generated from the transcript and can be wrong — check the timestamp.

Key Takeaways

  • Placer.ai combined with Spatial.ai offers granular demographic insights for targeted marketing.
  • Experian Mosaic data and Spatial.ai segments help identify key household types attending events.
  • Mapping data at census block group level reveals precise geographic concentrations of target audiences.
  • Understanding audience profiles like 'Good Life Citizens' aids in tailoring marketing channels and messages.
  • Spatial.ai supports strategic decisions on marketing spend and site location to maximize ROI.

What the video covers

  • Introduction to Placer.ai platform focusing on property reports and foot traffic analysis for Kendall Yards Night Market.
  • Explanation of demographic data segmentation using Experian Mosaic and Spatial.ai household segments.
  • Detailed breakdown of the C group segment, highlighting upper suburban diverse families as the primary audience.
  • Insights into the 'Good Life Citizens' segment including lifestyle, interests, and spending patterns.
  • Use of Spatial.ai for mapping household concentrations by DMA, zip code, and census block group.
  • Demonstration of how geographic data can optimize marketing efforts and site location decisions.
  • Exploration of audience overlap for retail chains like Trader Joe's and REI within Spokane DMA.
  • Discussion on the granularity limits of data and potential for local customization.
  • Overview of encrypted email lists linked to specific household segments for targeted campaigns.
  • Summary emphasizing Spatial.ai as a powerful tool nested within Placer.ai for granular demographic analysis.

Answers

Questions about this video

What is the main purpose of using Placer.ai and Spatial.ai together?

Placer.ai provides foot traffic and property reports while Spatial.ai offers granular demographic segmentation, enabling detailed audience analysis and targeted marketing strategies.

How does Spatial.ai improve marketing efforts for events like Kendall Yards Night Market?

Spatial.ai allows marketers to identify specific household segments, map their geographic concentrations, and tailor marketing channels and messages to the preferences and behaviors of those segments.

What kind of demographic data can be accessed through this tutorial's approach?

Users can access detailed household segments based on Experian Mosaic and Spatial.ai data, including income, lifestyle, interests, spending patterns, and even political and cultural preferences.

Full Transcript — Download SRT & Markdown

00:00
Speaker A
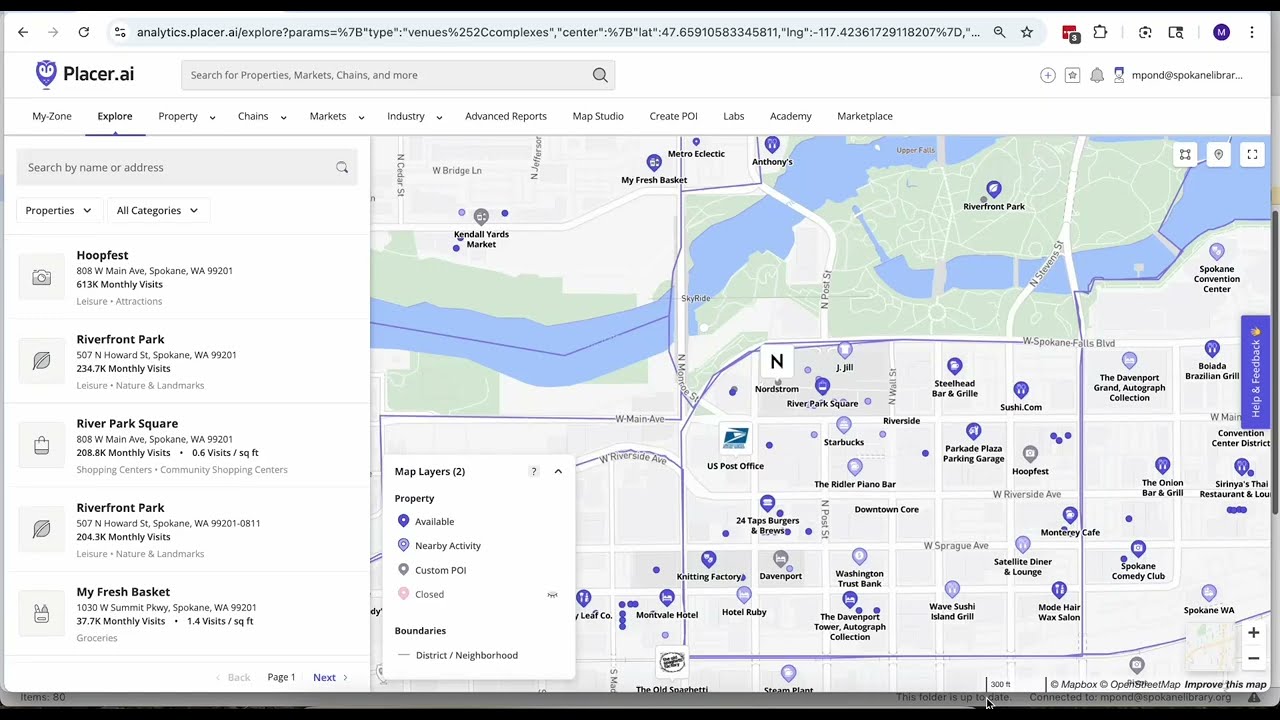
Hello there, folks. Mark here again, running you through another bit of information here with the Placer.ai platform. So I already recorded a tutorial where we looked at the property reports for the Kendall Yards Night Market, and I've kind of recreated that
00:18
Speaker A
here where we've set up our time frame and we're only looking at Wednesday nights from 4 to 10 p.m. all last summer. So from here, we already covered kind of just the overview of the information that you can get from the
00:32
Speaker A
property reports. But what I wanted to spend the time here today doing is diving into the demographics.
00:38
Speaker A
So if we come over here to the demographics tab there on the left-hand side, then we can start really getting a pretty fine-grain view of what types of households show up to the Kendall Yards Night Market. So, as we scroll down
00:54
Speaker A
here, the default kind of view is that Placer will give us kind of this expanding radius where 30% of the foot traffic and then 50 and then 70% where that's coming from. And you can play around with all those thresholds and you
01:11
Speaker A
can kind of toggle them on and off, but I think for just the sake of the example, I'm just going to set this for 100% of the foot traffic within that 50-mile radius. And then from there, as we
01:23
Speaker A
scroll down here just a bit, there are a number of different data sets that we can dig into and census-level data, spending pattern data for the households that show up to the Kendall Yards Night Market. So, there's oceans, if not
01:41
Speaker A
galaxies of data to splash around in here, but a couple in particular that are worth pointing out. So one, this Mosaic data from Experian, we've had access to that through another tool for a number of years and that's
01:55
Speaker A
just Experian credit reporting agency just sitting on trillions of consumer transactions. So anytime any of us swipe a credit card, Experian gets a ping and they know within a few milliseconds who you are and where you live and what you
02:11
Speaker A
just bought. So what they do with all of that data is they take every household in the US and they dump us into one of I think it's 72 different household segments. So that's super helpful on the marketing side of things. But
02:26
Speaker A
also when we got our license to Placer, we opted for this extra Spatial.ai add-in here. And the guy who developed Spatial, he was kind of a student of Experian for a number of years and this is kind of his platform that he came up
02:45
Speaker A
with that's very similar to that Experian data but I would say even more granular.
02:52
Speaker A
So, being able to see that for the folks that are showing up to the Kendall Yards Night Market, it looks like it's our C group here, it's the upper suburban diverse families. They're making up just over 17% of the foot traffic. And the
03:10
Speaker A
way to read through these bar charts over here, if we all went to the night market at the exact same rate, we would all have a score of 100 as that being the average. So for our C group with
03:21
Speaker A
a score of 191, that means they're 1.91 times more likely than average to be showing up at the Kendall Yards Night Market. So within each one of these, now that we know that it's our C group that kind of forms the bulk of this
03:36
Speaker A
this audience, if we go to this segment families and drill in here to the C group, then looks like it's our good life citizens that kind of make up the bulk of that biggest group. If we had time, it might be worth
03:55
Speaker A
kind of scanning through all of these other ones because combined our C group made up the biggest chunk, but there might be an outlier here or there that might come close.
04:05
Speaker A
Yeah, looks like our college kids actually slightly outpace our good life citizens in terms of who's showing up to the night market. But for the sake of this example, let's just focus here on our good life citizens.
04:20
Speaker A
And if you're wondering what is a good life citizen, seems like we should just be able to click there to get kind of the more detailed information. But what we have to do is come up here under
04:31
Speaker A
this advanced reports. And when we open that up, go to this Spatial.ai option there on the left-hand side. So here are the, I think it's 80 different household segments that Spatial puts us into. And overall structure here is really high income
04:48
Speaker A
households here at the top of the scale. And then as you work your way down, there are some kind of crosswinds that come into play here in terms of, you know, do you live in an urban
04:58
Speaker A
setting or are you out in the countryside somewhere? But overall thrust is high income at the top and then as you work your way down it tends to get progressively lower income. So that's kind of the structure
05:13
Speaker A
there. But for our good life citizens, let's get back up here. All right. So there's the profile for our good life citizens. And they tend to be between 45 and 54. They like dogs and beer and sports and the outdoors.
05:35
Speaker A
They watch Seinfeld. They drive Subarus. Kind of some income ranges there. The hashtags that they've been using over the last couple of weeks, retail establishments where they overindex. So, they're what is that 2.57 times more likely than average to be showing up at
05:55
Speaker A
Jill. And yeah, so a lot of this is for either kind of national or regional chains, but we can, should we have the need, we can dive in and make it a little bit more local. But this data
06:08
Speaker A
just goes on and on of what stores they go to, channels you should be using to reach out to them, the websites that they visit, who do they follow in the online world. So if we dig in here to
06:21
Speaker A
their influencers, then yeah, it's Glenn and Doyle and Kyrisd Doll and Stevens Keep. So kind of the NPR crew. Then from there, the causes that they're associated with and the political influencers that they follow, the comedians that they like.
06:41
Speaker A
So, it gets to kind of a silly level of detail here after a while, but you have all of that data for pretty much every, well, you have all this for every single one of those household segments. So,
06:53
Speaker A
there's that. Also, just know that we can map all of this data if we're so that we can find where the concentrations of these households are across the nation. So if we zoom in here to Spokane, so we can map these
07:10
Speaker A
households at a couple different levels. So either this DMA, which is designated marketing area, which is basically TV broadcast regions. So for us, it's all eastern Washington into northern Idaho and some slivers of Montana and Oregon, but that's what
07:29
Speaker A
the DMA is. And then zip code and then census block group. That's usually roughly about 400ish households to 800ish households. So that's kind of the most fine-grain view there. So if we're trying to figure out, all right, where
07:45
Speaker A
do our good life citizens get clustered up on a map, we can do that. And being able to see that. Okay, here on the South Hill and actually let me turn on the regular map because even though the contrast isn't
08:01
Speaker A
great, it does a better job of kind of showing where these households are. So this particular census block right here, that's Grand, there's 37th, there's 42nd with the Rocket Market right there. So that particular census block group right at 70% of them of
08:19
Speaker A
those households there are good life citizens. But just over here on the bluff a few blocks away it's down to 17%.
08:28
Speaker A
Right around the corner at the Manito Golf Club it's effectively down to zero. Completely different set of household types that are located right there. So if you're trying to market to good life citizens and you're spending any time or money
08:47
Speaker A
on marketing efforts in that area right there, it's just money wasted. Not going to get you where you need to go.
08:54
Speaker A
Other fine folks live there, but just not your C wants. So that gets used a ton for site location types of questions as well as, you know, marketing efforts.
09:03
Speaker A
Where do you spend your marketing dollars? That can really help address those particular topics. The explore option here, not quite an infinite number of data points to play around with here but one step dialed back from
09:21
Speaker A
that.
09:37
Speaker A
who here let's just use this as as the example. So who goes to Trader Joe's the most across the nation and we change that to the segments. All right, it's our satellite scions and our exclusive exper. Those are the two
09:58
Speaker A
household types nationwide that are going to Trader Joe's the most. But we can narrow this down to the DMA level to say, all right, here in the Spokane DMA, who's going to Trader Joe's the most?
10:12
Speaker A
And now we've got our good lights life citizens showing up here. And then also our northern lights. Those are the folks here locally who are going to Trader Joe's the most. So, that can be super helpful. Also, if we come over here to
10:27
Speaker A
this little grid icon, what this allows us to do is basically take any one of these metrics, and there are thousands of them, and basically plot them against any other metric. So, we could say, all right, who goes to Trader Joe's and
10:44
Speaker A
are they on Tik Tok or are they on Facebook? So, we can figure out which social media platforms we might want to uh put our focus on. Also, we could say, all right, you know, who goes to Trader
10:59
Speaker A
Joe's and REI? Is that an overlapping audience? And then what we're looking for here are households kind of the further to the right and the further up those will be our best matches. So it looks like oh yeah actually it's our good life
11:19
Speaker A
citizens once again that that's kind of the peak of those two curves at least here in the Spokane DMA for folks that are going to REI as well as Trader Joe's. So ton of application there. this append option. What this allows you to
11:38
Speaker A
do is if you have a list of ad household addresses then so if it's shipping logs, if you've been shipping product out across the nation, or if it's a donor list for a nonprofit, as long as they're just household
11:52
Speaker A
addresses, upload them here, uh save them as a CSV file, then toss them in here. And then what Placer will or actually Spatial will produce is a report that looks like this.
12:07
Speaker A
And this was a a list of likely Spokane area dog owners. But let's pretend like this is your list of clients or or donors.
12:17
Speaker A
And being able to see of the 400 addresses that we uploaded, 28% of them, just under 28% are the Rust renter household types. even though they make up less than 2% of the local population. So, they're overindexing more than 15 times. So, that can be
12:36
Speaker A
super helpful to get a snapshot of who your donors are, who your customers are.
12:42
Speaker A
And this especially comes into play in the online world where if you have a brick-and-mortar store, you have the advantage of seeing your clients pulling up in your parking lot and you can often kind of piece together a pretty
12:56
Speaker A
comprehensive story about who they are and, you know, age and income and how many kids and what they drive. But if you're operating purely in the in the online world, that can get really opaque and really hard to figure out who it is
13:10
Speaker A
that you're dealing with. and this can really help solve some of that. So, that's what's happening with the append option. Um, the analyze, they basically just took this and moved it over to the explore page. So, I'm guessing that will go away here sometime
13:26
Speaker A
soon. But the activate, this kind of closes the loop here. So, if we go to create a new audience, then spatial, it'll tie in directly to a number of different platforms. But let's say you've figured out that our good life
13:42
Speaker A
citizens, maybe they're on Reddit a ton. I don't know if they are or not, but we can figure that out. So, what we can do is come in and start creating a campaign looking at our good life citizens.
13:57
Speaker A
And for these campaigns, we can narrow it down to either the state level or DMA. Um, it would be nice if we could get more granular than that, but at least for now, that's that's where where it stops. But we can throw in a number
14:11
Speaker A
of other filters. So, if we know kind of the peak of the curve for our good life citizens are mid-40s to mid-50s, we can, you know, throw out those outliers.
14:22
Speaker A
Also, income ranges that you might want to be focused on. Um, education levels, male, female, married. Yes. No. Kids?
14:33
Speaker A
Yes. No. So, with those filters selected, then we've got just under 3,100 Good Life Citizen contacts here in the Spokane DMA that match all of those filters. And when we run this, what we'll get is a report that looks
14:53
Speaker A
like this. And this is an encrypted list of email accounts so that that are associated with those C1 households with all those various filters that we put into that search.
15:11
Speaker A
And in this case, it's formatted in a way so that when it gets uploaded into Reddit, Reddit knows how to um decode these these encrypted emails. And then if it's an email that has a profile and an account on Reddit, when you run your
15:30
Speaker A
marketing campaign, your ads are going just to those specific email accounts. And if it's an email that Reddit doesn't recognize and they don't know who they are and they're not on the Reddit platform, they just drop off and yeah,
15:43
Speaker A
they they kind of just fall by the wayside. But this allows you to get super targeted, super um specific about who it is that you're trying to reach out to with your marketing campaigns.
15:55
Speaker A
So that is the flyby of spatial.ai. And just kind of think of spatial as this tool that kind of nests within Placer. And yeah, it's it's pretty powerful. So, um, I know that this tutorial is a little bit longer than I I
16:15
Speaker A
like to make them, but it's about as short as I can make it and kind of be able to cover all the ground that I wanted to cover. But just know that there's a ton more information and utility and
16:26
Speaker A
functionality that we can dig into here with especially within Placer. But with that, we'll stop there and happy marketing.
Topics:Placer.aiSpatial.aidemographicsmarketing analyticsExperian Mosaichousehold segmentationfoot traffic analysisKendall Yards Night Markettarget audience mappingsite location strategy

Get More with the SozAI App

Transcribe recordings, audio files, and YouTube videos — with AI summaries, speaker detection, and unlimited transcriptions.

Or transcribe another YouTube video here →