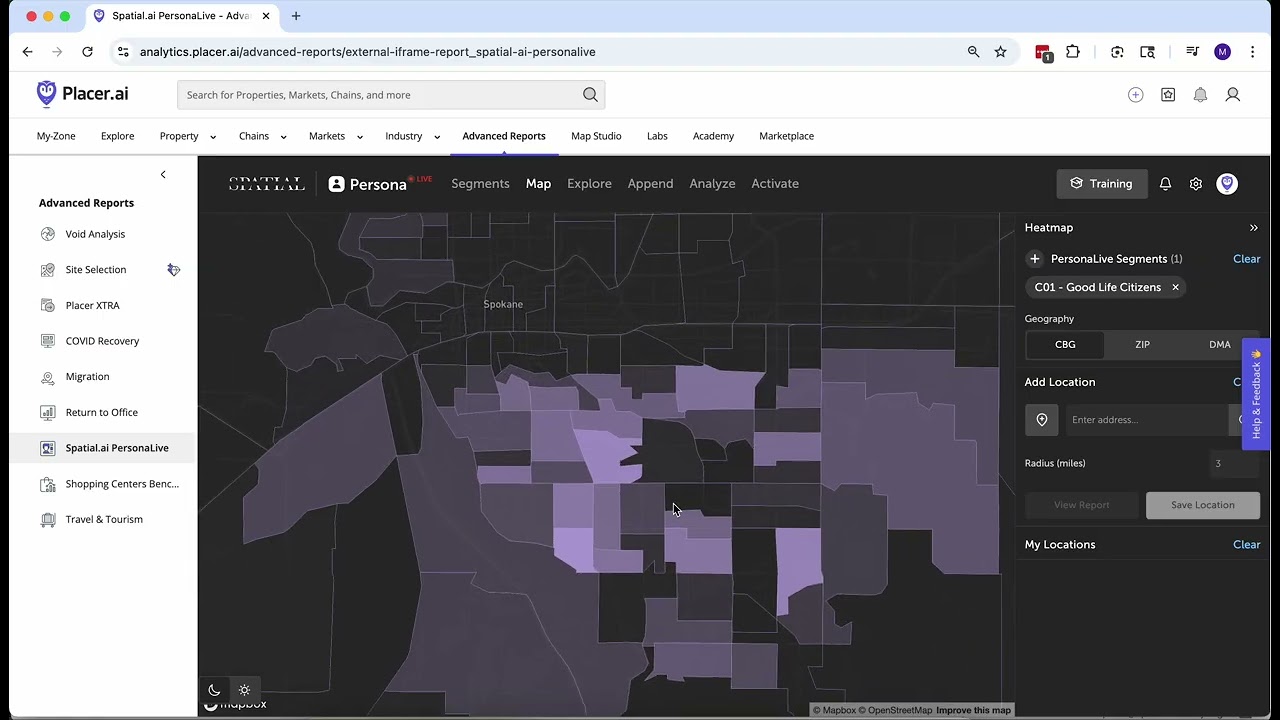
Overview of Placer.ai, a foot traffic monitoring tool used by Spokane Public Library to analyze geofenced locations and visitor data.
Ask about this video. Answers come from its transcript only — with the timestamp, so you can check them.
Generated from the transcript and can be wrong — check the timestamp.
Key Takeaways
- Placer.ai is a powerful tool for monitoring foot traffic with customizable geofencing and time filters.
- It provides near real-time data with historical depth dating back to 2017.
- The platform offers actionable insights including visitor origins, behavior, and movement patterns.
- Limitations include inability to geofence sensitive locations and challenges with multi-story buildings.
- Heat maps and detailed reports can support marketing strategies and site selection.
What the video covers
- Mark from Spokane Public Library introduces Placer.ai, a platform that tracks foot traffic using geolocation data from devices.
- Placer.ai allows users to create geofences around locations in the US, with restrictions on sensitive sites like healthcare and schools.
- The tool struggles with multi-story buildings as it only tracks location from above, causing some data fuzziness.
- Users can customize date ranges and time filters to analyze specific events, such as the Kendall Yards night market.
- Data is updated frequently, with information available from 2017 to as recent as three days prior.
- Placer.ai provides detailed foot traffic patterns, including spikes on event days and explanations for anomalies like cancellations.
- Heat maps show where visitors live, aiding marketing and site location decisions.
- Additional insights include visitor behavior before and after visits, travel routes, visit times, and duration of stay.
- The video promises a follow-up covering demographic details of visitors.
- Overall, Placer.ai offers valuable data for businesses and event organizers to understand and target their audience.
Chapters
- 00:00Introduction to Placer.ai and its data sources
- 00:27Geofencing capabilities and restrictions
- 00:59Limitations with multi-story buildings
- 01:32Example use case: bakery client and farmers markets
- 02:37Data currency and date range customization
- 03:13Time filtering for specific event analysis
- 04:29Foot traffic patterns and anomaly explanation
- 06:07Heat maps and visitor origin insights
- 07:22Additional visitor behavior and travel data
- 07:48Conclusion and teaser for demographic details video
Full Transcript — Download SRT & Markdown
Speaker A
Hi there, folks. Mark here with the Spokane Public Library, and the task for today is giving you a quick overview of a new tool in our toolbox, Placer.ai.
Speaker A
And at its heart, Placer is basically a foot traffic monitoring type of platform. So they're looking for those of us who are wandering around with geolocation turned on on our devices.
Speaker A
So that kind of forms the backbone of their data, and then they've got a number of different other data sources that feed into that. But, um, the way that this works is Placer allows you to basically put a geofence around any location in the
Speaker A
US from as small as 5,000 square feet on up to basically as big as you might want to make it. There are some limitations with that though. They don't allow you to put a geofence, say, around sensitive locations like healthcare facilities
Speaker A
or a childcare center or middle school or military installations. So things along those lines, they don't allow for that. One other stumbling point in terms of kind of setting up those geographic boundaries that you might stumble into is using kind of the River
Speaker A
Park Square Mall here as the example. Since Placer is just looking straight down from above for the geolocation for multi-story facilities like River Park Square, it makes it really hard for Placer to tell, like, are you up
Speaker A
on the third floor at Whiz Kids or, say, are you down on the ground floor at Williams Sonoma? So just know that sometimes data on that front can get a little bit fuzzy. So, as an example, uh, I'll just go ahead and run
Speaker A
you through a couple of different features and bits of functionality here within Placer, but as the example, I have a client that I've been working with off and on, and she's interested in opening up her own bakery going forward
Speaker A
here in the coming year, but this year, she really wants to get out and kind of test her products at farmers markets. So with Placer, what we can do is say, for example, just put a geofence
Speaker A
around the location where the Kendall Yards night market happens to occur. And when we open these reports, there's a lot of information to dive into here. So Placer, they have data going back as far as 2017 to as recent as
Speaker A
three days ago. Um, so super current. I, I've not come across any other tool that allows for that quick of a turnaround in terms of updating their data. But also, this allows us to set up our geographic time frame really however
Speaker A
we want. So, if we're looking at the Kendall Yards night market, we can say, all right, who showed up there over the last 30 days? But also we can put together kind of a customized range. So we could say, all right, yeah, so from June
Speaker A
1st of last year, let's go change this to 2024. Let's say through the end of September.
Speaker A
There we go. Sometimes the calendar is a little squirrely there, but there we go. So now we've got April, actually April 1st through the end of September of last year. But then if we really want to be able to zero in on just those
Speaker A
types of households and, you know, be able to dig into the statistics of who actually shows up for just the night market. Night market happens on Wednesdays and from like 4 to 9 or 10 p.m. So running this for all of the
Speaker A
summer, that isn't going to really help us. So if we come and add this filter, then we could say, all right, let's just look at Wednesdays within that date range. Then also let's say from 4:00 p.m. we'll say until
Speaker A
10 p.m. Then let's apply that. And then once we have kind of that geographic region pinned down as well as our time frame, then we can really start digging into the meat of this. So give this a second to go ahead and
Speaker A
load. All right. So, according to Placer, we had about 35 and a half thousand folks showed up over the course of those Wednesday nights throughout the summer. And then as we scroll down here, then we get those foot
Speaker A
traffic patterns. And every one of those spikes should be a Wednesday. So, as we're looking here, I'm not exactly sure when the night market starts, but I'm guessing towards the end of May might be the first time. But then it really picks up
Speaker A
in early June. But then as we look at this data, we can say, "Huh, that's weird. What happened on Wednesday, July 10th?" And when we open up one of those data points, then we get a little bit of
Speaker A
a snapshot here of kind of what was going on. And as you might recall, that was the day that it was, I think it got up to 106, and the night market was canceled that night. So that's reflected in the data.
Speaker A
So from there, as we scroll down, so this is kind of one of my holy grails of stuff that I've been looking for for a number of years.
Speaker A
And so through other tools, we can tell all right how much people are spending on fresh produce around town over the course of a year as an average, but we could never tell where people were actually going to spend those
Speaker A
dollars. So now we have these heat maps showing where the households are located that are going to Kendall Yards Night Market. So that is super helpful for marketing efforts for maybe site location types of questions if you're trying to attract a similar clientele as
Speaker A
to what's showing up at the Kendall Yards night market. So pretty heavily, I know, lower south Kendall Yards, that kind of makes sense, but also right around Gonzaga, a lot of Gonzaga students are making the track over to the Kendall Yards. So, if
Speaker A
I were the Kendall Yards night market manager, I'd maybe look into running a shuttle back and forth between the night market and Gonzaga just to make it a little easier for those folks to get to and from. So, from there, then we've got
Speaker A
census level data of kind of where those households are located, also other places where people go to Kendall Yards night market, where else they tend to go, and then are people coming from home to go to the night market and then after
Speaker A
they leave, do they go out to a restaurant or do they go back home? Uh, the streets and roads that they take to get both to and then from the property.
Speaker A
Uh, what time they show up, how long they tend to stick around. So that's all just within the property report here within Placer. So I'm going to stop there with this video, but I'll record a subsequent one where it
Speaker A
gets extra levels of detail in terms of the demographics of who shows up there.
Speaker A
But, uh, stay tuned for that. I'll get that up and going here just in the near future.
Topics:Placer.aifoot traffic monitoringgeofencingvisitor analyticsSpokane Public LibraryKendall Yards night marketlocation datamarketing insightsproperty reportevent analysis