NWOGS & NDOGS Explained — Transcript

Learn how to identify and use new week and new day opening gaps in futures trading to enhance your intraday and weekly strategies.

Key Takeaways

  • New week opening gaps are crucial weekly levels derived from the Friday close to Sunday open price gap in futures.
  • New day opening gaps form during daily market closures and provide important intraday support and resistance levels.
  • These gaps have defined internal levels (25%, 50%, 75%) that traders can use for entry and exit points.
  • NWOGS remain relevant for the entire week regardless of price movement, while NDOGS are used for the day they form.
  • Using these gaps consistently can improve trading precision and market understanding in futures trading.

Summary

  • The video explains the concept of new week opening gaps (NWOGS) and new day opening gaps (NDOGS) in futures markets.
  • NWOGS are gaps between Friday's close and Sunday's open, used as key price levels for the entire upcoming week.
  • Each NWOG contains three important levels: 25%, 50%, and 75% of the gap range, which act as sensitive intraday trading levels.
  • NWOGS remain on the chart for the whole week regardless of price action moving above or below the gap.
  • The presenter only uses the current week's NWOG and does not consider historical gaps.
  • NDOGS occur during the daily one-hour market closure in futures (4:45 p.m. to 6 p.m. New York time) and are used for intraday trading.
  • NDOGS are extended until the next daily close or until a new gap forms, acting as support or resistance levels.
  • The video emphasizes the importance of visible, meaningful gaps (not just one tick) for these strategies.
  • Future videos will explore the three levels inside these gaps in more detail through projected defined ranges.
  • The presenter encourages joining a free Discord community for daily levels and active trading discussions.

Full Transcript — Download SRT & Markdown

00:00
Speaker A
Today, we're going to be talking about new week opening gaps and new day opening gaps. So, these become some of the most important levels that I use week to week and day to day in my trading.
00:09
Speaker A
Now, before we begin, join the Discord in the description. There's a whole free section. I'm showing my levels daily for free for everybody. I'm active in the questions channel every single day for free for everybody. And there's a whole
00:20
Speaker A
chat of hundreds and hundreds of people at this point that are just like you watching the same videos. It's a good resource. It's completely free. There's no reason why you wouldn't join. So, without further ado, join the Discord
00:31
Speaker A
and let's get back to the video. All righty. So, what I have here is an entire week of price action and we're looking at the 15-minute chart. We're going to start with new week opening gaps. And as the name implies, those are found at the
00:46
Speaker A
beginning of the week. So, when Friday closes and when Sunday's trading opens, if there is a gap in price between the close of Friday and the opening of Sunday, that range where that gap exists is going to be your new week opening
01:05
Speaker A
gap. Now, it's not this. This is not what I'm talking about. This looks like what the gap would be. And a lot of people mistakenly mark it like this because this is where price action was not traded. But that's not the
01:17
Speaker A
difference between the closing price on Friday and the opening price on Sunday. The closing price on Friday would be the closing price of the last candle that was traded and the opening price on Sunday would be the opening price of the
01:30
Speaker A
first candle that was traded. And then what you're going to do with this range of price is you're going to extend it for the entire week of price action. So, you want to utilize this gap for the entire week. A new week opening gap gets
01:43
Speaker A
used for the entire week of price action. Now, just like any gap, this has three levels inside of it. So, from the bottom of the gap to the top, you want to mark out the 25% level, the 50%
01:56
Speaker A
level, and the 75% level. And these are your three levels inside of a new week opening gap. Okay? So, again, just to be clear, this is how you define a new week opening gap. They stay on your chart and
02:08
Speaker A
they're utilized for the entirety of the entire week of price action. Now, if price action was to open and close underneath this gap, it doesn't matter.
02:17
Speaker A
It's still there. You're still going to use it. Price action could do whatever it wants inside of this gap until the end of the week. You're going to keep this on your chart. And these are going to act as sensitive levels throughout
02:27
Speaker A
the entirety of the week. Okay? For the whole week, the top of the gap is going to be sensitive. The levels inside the gap are going to be sensitive for the whole week. These are going to be important levels intraday for your
02:38
Speaker A
trading. Unlike other gaps, new week opening gaps do not turn inversion. They don't go away and you don't delete them from your chart until the week is over.
02:47
Speaker A
You use the new week opening gap until the week is over. Now, there's going to be some people on the internet and there's some things you see on the internet where it says you could use old new week opening gaps. You could use up
02:56
Speaker A
to 10 new week opening gaps in the past, etc. You could have a ton of them on your chart. You could listen to them, but if you're trying to listen to me, me personally, I only use the one for the
03:07
Speaker A
current week. I don't look backwards. I don't use a ton of them. I just use the one for the current week in the week that it's in. And that is it. So, if we look at another week of price
03:17
Speaker A
action just to make sure we really have the hang of this here, this is going to be a smaller new week opening gap. But if we bring our mouse over to the Friday gap right here and keep in mind this
03:28
Speaker A
only happens on futures. So, any futures asset, gold, currency futures, stock index futures like ES or NASDAQ.
03:36
Speaker A
We go from the Friday to the Sunday. And if there's a gap here, sometimes there's not going to be a gap. Sometimes the gap's going to be one tick. If the gap is one tick, do not use it. Okay?
03:48
Speaker A
The gap needs to be visible. It needs to be decently sized over a handful of ticks. And there needs to be a gap for you to use it. So, you're going to take the closing price of Friday. Why is it
03:59
Speaker A
this level? Because look, this is where the final up candle closed. This is where the final candle closed on Friday and the opening price of Sunday. That's going to be your new week opening gap.
04:11
Speaker A
You're going to take this range and you want to utilize this and extend this for the entire week of price action. Okay, this stays on your chart for the whole entire week. And this has three levels inside of it. Now, in a video very soon,
04:28
Speaker A
we're going to be deep diving into the three levels inside of these things when we talk about projected defined ranges.
04:33
Speaker A
But for now, just treat them as levels that price could bounce back and forth in between. But do know that these are much more powerful than I'm letting on. And projected defined ranges are going to change how you look at a lot of
04:46
Speaker A
things in the market. But as you can see throughout the whole week, this becomes quite a sensitive area of price and it will be like that. So, again, this is how you mark new week opening gaps. Now, these new week opening gaps aren't the
05:01
Speaker A
only gaps that I recognize in price action when it comes to a closure of the market. So, again, Friday closes trading until Sunday. Well, there's also a closing every single day for an hour in the futures market. And if you're
05:18
Speaker A
looking at my time zone, so my time zone is Anchorage UTC-8. If you're looking at New York time zone, that's going to be 4:45 p.m. to 6 p.m. Every single day, the market closes for one hour. In that
05:33
Speaker A
difference, there's no trading. So, if there's a gap there, that's what we call new day opening gaps. So, if we look at this first closure on Monday here of this week, you see 4:45. If you look at the bottom, the time stamp at the bottom
05:44
Speaker A
of the chart there, it says 4:45 to 6 p.m. But notice the close at 4:45 and the open at 6 p.m. There's no gap here.
05:52
Speaker A
There's no gap at all, at all here. So, we do not have a new day opening gap.
05:57
Speaker A
So, again, if we go into Tuesday, now this is Tuesday's gap right here. You have a gap. So, the closing price at 4:45 and the opening price at 6:00 p.m.
06:07
Speaker A
are different. So, this would be your first new day opening gap that appeared in the week. Remember, we didn't have one Monday. Tuesday was the first one that we had. And for me, I use these just like new week opening gaps where I
06:21
Speaker A
only use them for the week that they were created. I use new day opening gaps only for the day that they were created.
06:26
Speaker A
So, you could extend this along all the way through Tuesday. And because my time zone's a little bit weird, also all the way through Wednesday, basically until the next 4:45 p.m. if you're looking at New York time. So, you basically use
06:40
Speaker A
this from 4:45 p.m. to 4:45 p.m. Now, if a new new day opening gap doesn't happen on the next 4:45 p.m., you could extend this into the next day. Okay? But if a new one does show up, which we have
06:56
Speaker A
here, as we can see on Wednesday's close at 4:45 p.m., we have quite the gap here, you're going to want to just utilize this. Okay, so this is the close here of 4:45. This is the open of 6 p.m.
07:07
Speaker A
We're going to drag this along to where? Pretty simple. We're going to drag this along to 4:45 p.m. right here. And again, just like any gap, you still have the levels inside of them. For now, just think of
07:22
Speaker A
these levels as levels you could hold a side of. Again, once we get into projected defined ranges, these will become much more powerful. And when you're above these new day opening gaps, they hold as support. When you're below
07:31
Speaker A
them, they hold as resistance. And that's just how they work. Now, going into the next day here, we do have a gap. This one's pretty small. So, this is the 4:45 candle on Thursday. This is the 6 p.m. when it reopens. This is
07:47
Speaker A
relatively small, but it's still a
07:55
Speaker A
And as you could see, it's still something that's being actively respected in the market. This little new day opening gap right here is going to be the one that you want to utilize in this range. So again, if for example
08:10
Speaker A
there was no new day opening gap here, you would have been able to just extend the prior one all the way through the next day as well. And yes, in this case, it looks like the prior one was respected
08:24
Speaker A
here. And they will be they will be respected like that. And you'll see a lot of people on the internet telling you that you could use these new day opening gaps for the entire week that they're active. For the entire week that
08:34
Speaker A
they're active, for the entire week that they're active. But for me, just to keep things short, sweet, simple, I only use new day opening gaps in the day that they were created. Um, and that's just what I do, okay? Unless, again, a day
08:49
Speaker A
doesn't have a new day opening gap, and then I'll extend the prior one through that through that day. All righty. So, that's new day opening gaps and new week opening gaps in my way of viewing them.
09:00
Speaker A
And congratulations if you've watched every video in the playlist for the boot camp so far. We're done with technical analysis. We're done with the basic founding parts of technical analysis.
09:12
Speaker A
And now we can move on to very interesting much much more useful things of how to actually utilize these levels to form a real edge. How do we pick the levels that we're going to use on a day-to-day basis? How do we start
09:25
Speaker A
developing a strategy around these levels that we could use to take money out of the market every single day? So, pat yourself on the back if you've watched all these videos. Your homework is to go through all the videos that
09:36
Speaker A
you've watched in the playlist so far. Make sure you understand all the things that I've shown because it's about to get much much much more advanced and a little bit more complicated. So, these foundational parts are the very basics
09:50
Speaker A
and you're going to need to understand them in order to continue in this playlist. So, I'm done here. This was new day opening gaps and new week opening gaps. I'll see you in the next video for the new
10:02
Speaker A
section of the boot
Topics:new week opening gapsnew day opening gapsfutures tradingintraday trading levelsprice gapstrading strategyprojected defined rangesmarket support and resistanceES futuresNASDAQ futures

Frequently Asked Questions

What is a new week opening gap (NWOG)?

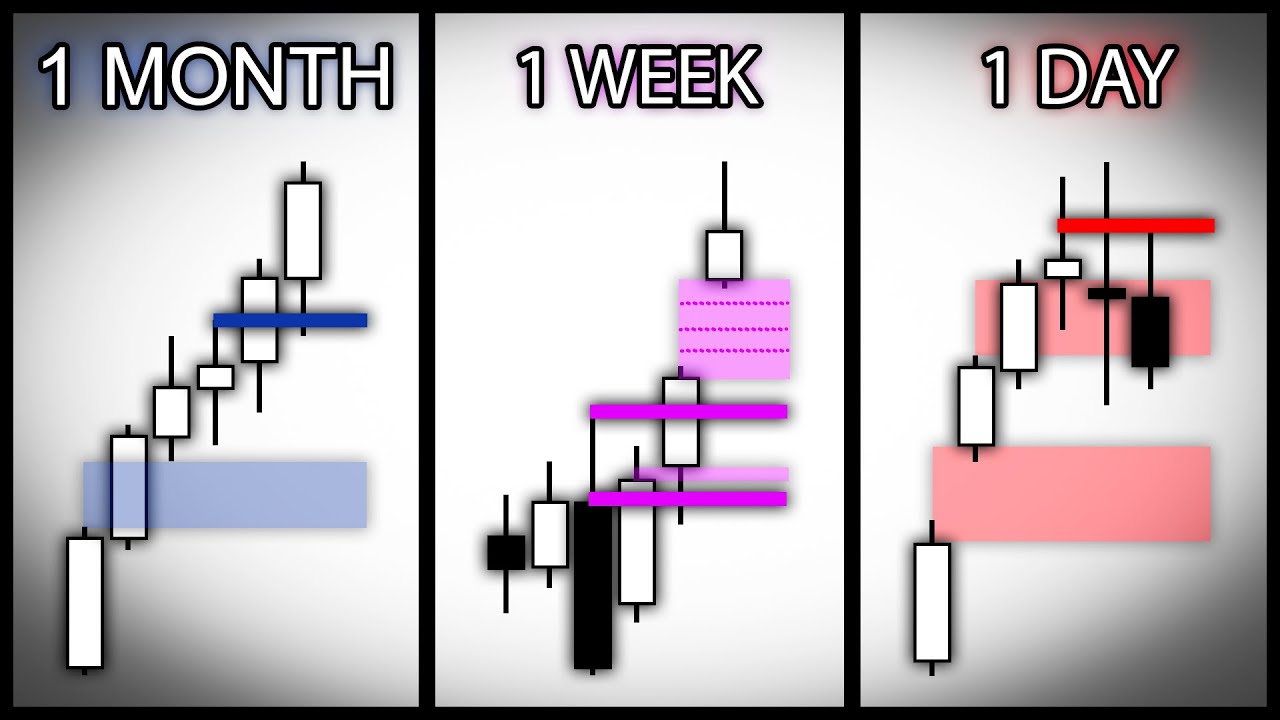
A new week opening gap is the price gap between the closing price of the last candle on Friday and the opening price of the first candle on Sunday in futures markets. This gap is extended and used as key trading levels throughout the entire following week.

How are new day opening gaps (NDOGS) different from NWOGS?

New day opening gaps occur during the daily one-hour market closure in futures (typically 4:45 p.m. to 6 p.m. New York time) and are used as intraday support and resistance levels. Unlike NWOGS, NDOGS are used only for the day they form.

How should traders use the levels inside these gaps?

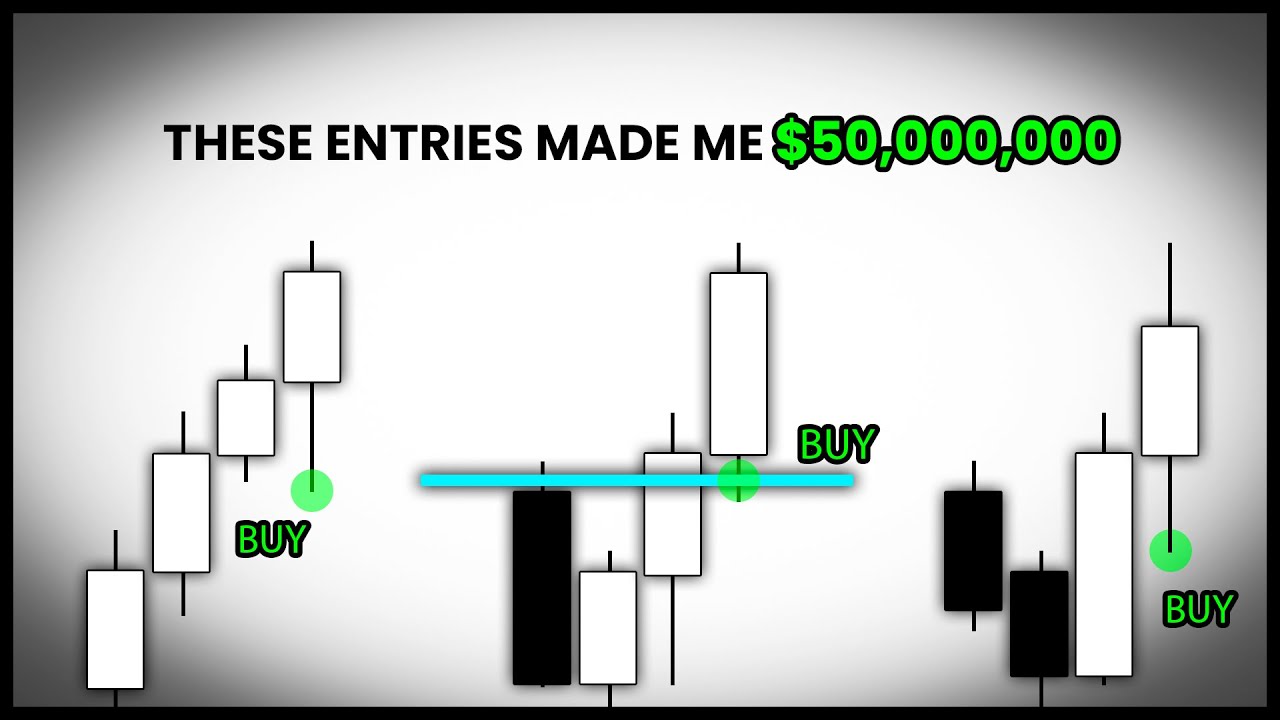
Each gap contains three internal levels at 25%, 50%, and 75% of the gap range. Traders use these levels as sensitive price points where price may bounce or reverse, helping to identify potential entry and exit points.

Get More with the Söz AI App

Transcribe recordings, audio files, and YouTube videos — with AI summaries, speaker detection, and unlimited transcriptions.

Or transcribe another YouTube video here →