f*ck it. handing you the strategy that changed my life … — Transcript

Learn the Four Pillars Model, a unique trading strategy that generated $10M+ in profits by focusing on liquidity sweeps, high timeframe levels, and internal confirmations.

Key Takeaways

  • The Four Pillars Model is a comprehensive, step-by-step trading strategy focusing on liquidity, levels, bias, and confirmations.
  • High timeframe levels and liquidity sweeps are crucial for setting up high-probability trades.
  • Immediate bias based on short-term moves is preferred over daily bias for more precise entries.
  • Multiple internal confirmations can be taken within one setup, increasing trade opportunities.
  • Optimizing for exposure rather than individual trade win rate leads to consistent, superior performance.

Summary

  • The video introduces the Four Pillars Model, a unique trading system developed and used by the creator for over five years.
  • The model averages about 60 R (risk multiples) per month, outperforming most trading systems in the space.
  • The Four Pillars consist of: 1) liquidity sweep, 2) high timeframe levels, 3) immediate bias, and 4) internal confirmation for entries.
  • Liquidity sweeps involve price moving below prior lows for buys or above prior highs for sells, focusing on specific liquidity pools.
  • High timeframe levels are marked mechanically and differently than common methods, enabling clear bias through projected defined ranges (PDRs).
  • Immediate bias is based on the next move between high timeframe levels, not daily bias, focusing on short-term price action.
  • The first three pillars create a 'stage' where multiple internal confirmations (entry signals) can occur until the bias completes.
  • Internal confirmations can be various price action signals such as retests, order blocks, fair value gap inversions, or level regains.
  • The setup’s probability to move from one level to the next is about 70%, but individual trade win rates are less important than overall exposure.
  • The strategy emphasizes exposure over win rate, allowing multiple entries per setup to maximize profit potential.

Full Transcript — Download SRT & Markdown

00:00
Speaker A
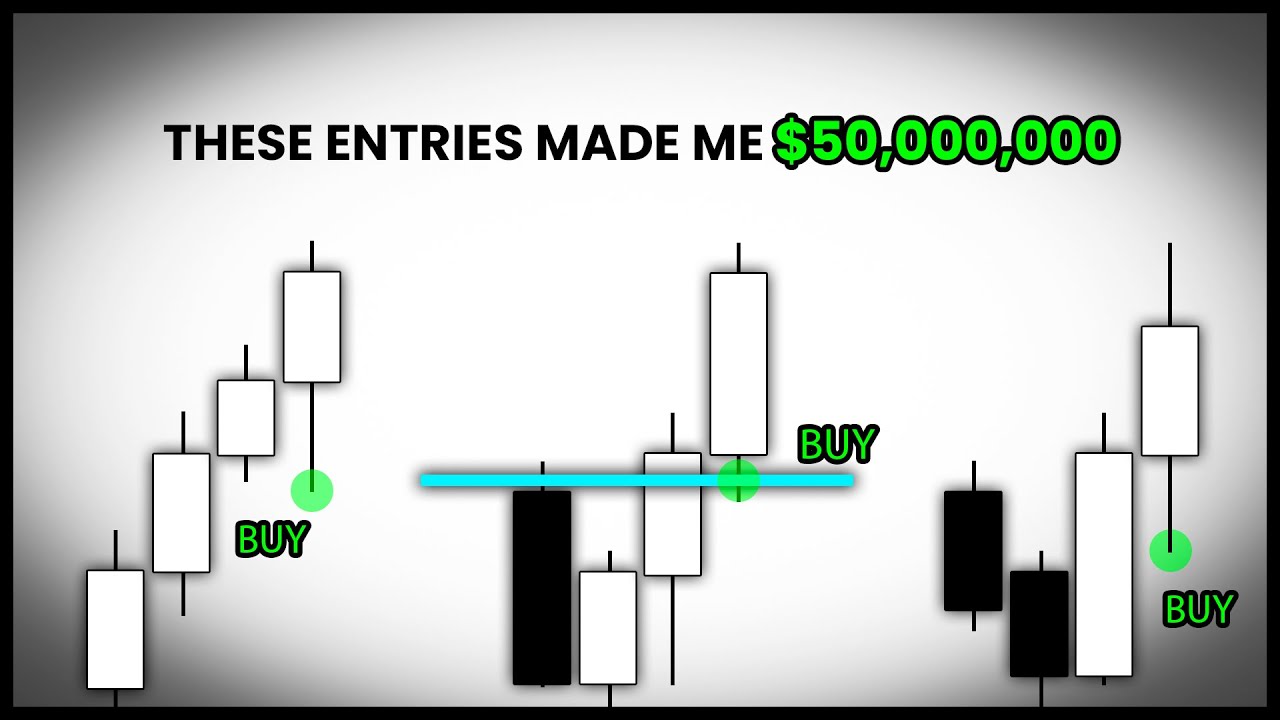
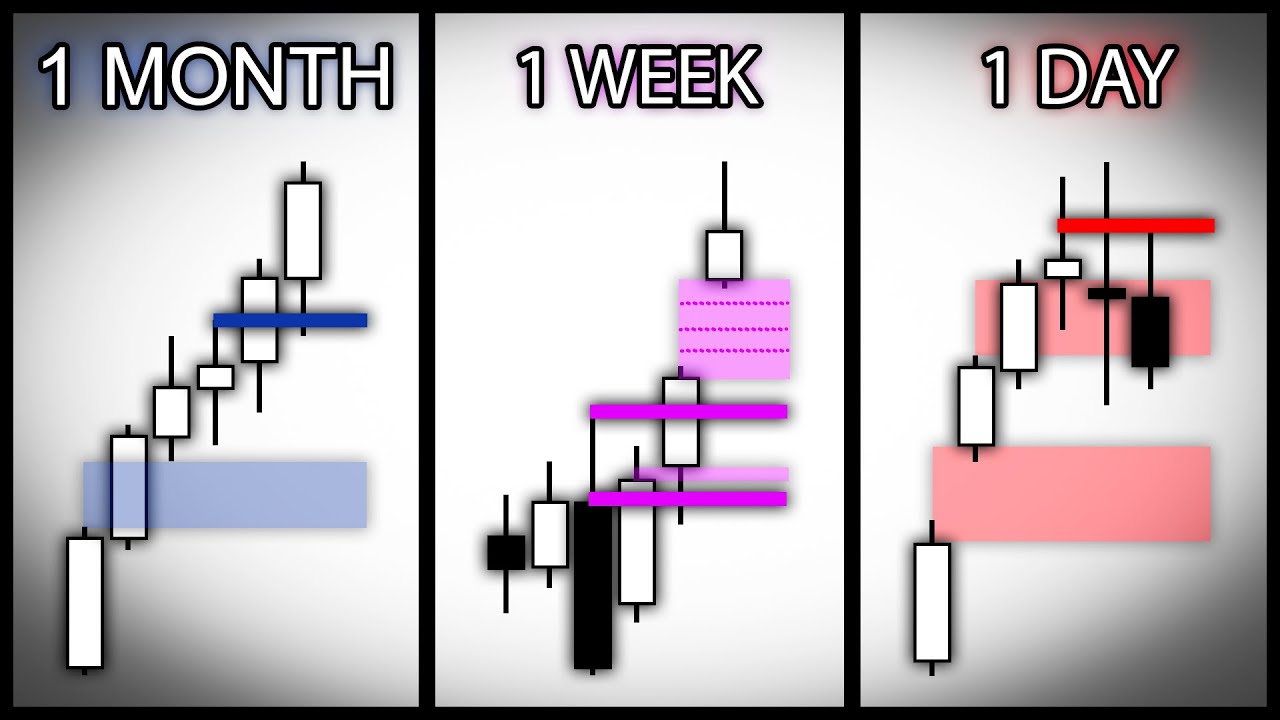
I've been trading with the system that I'm going to teach you in this video for over half a decade at this point. And over that time, on average, I make about 60 R a month. Now, those statistics are pretty incredible if you compare those to almost any system in the space. The results don't even come close. And the reason that those statistics are able to be that high is because this is a very unique system. You will not see anybody else on the internet trading like this, and you won't see anybody else on the internet thinking about trading like this. So in today's video, we're going to put together the whole system. I have taught most of it for free on YouTube in parts, but in this video, we're going to be putting it all together, showing you how to use it day by day, and then also giving you some insight on the philosophy of the system and how to think about the market. So first and foremost, the name of my model is the Four Pillars Model or the Four Pillars Setup, whatever you want to call it. But the Four Pillars is the name because there are four distinct steps that you follow when you are utilizing this model. Now, this model covers everything from how you mark the levels to how you determine bias to how you actually enter as well. And the Four Pillars Model kind of extends out to my general trading philosophy as well. And it talks about how I value exposure over win rate and how I think about the market in a way that allows me to perform dramatically better than almost anybody in this space on a very consistent basis. And it's not just me. My students do as well. At this point, I've been doing this internet stuff for a very long time. I've been trading for a very long time, and a lot of people have learned from me and also had very similar results. So, this video is going to go over it all and put it all together. The Four Pillars are as follows in this order. First and foremost, and the very first pillar, is a liquidity sweep. So, if you're looking to buy the market, we need a liquidity sweep underneath old lows. Or if you're looking to sell the market, we need a liquidity sweep above old highs. Now, this is very basic stuff. Everybody talks about liquidity sweeps. This part of the setup is nothing new, but we do need a liquidity sweep. And going forward, when we talk about actually implementing this model, we'll talk about the very specific liquidity sweeps that we look for because not just any liquidity sweep will do. I'm not looking at some random 1-minute level or 15-minute lows or whatever. I'm looking at very specific liquidity pools that need to be swept. Again, we'll go over those once we get into the actual execution part of this video. But for now, the very first pillar, and in your head, and remember, I'm telling you these in order. The order is more important than the position where you find these things. The order is more important. The very first step for this model to show up is a liquidity sweep. If you're looking to buy the market, the market needs to run underneath prior lows. If you're looking to sell the market, the market needs to run above prior highs. Now, the second part of this setup is your high time frame levels. Now, how I mark high time frame levels is very different than how many people do. We're going to have a brief rundown of them in this video, a brief overview of how I mark them in this video. I have an entire video on my YouTube channel dedicated to high time frame level picking, but it is a mechanical process, and it's the same thing every single day. So, this is a very mechanical way, but nobody marks levels like I do. And when you do mark levels like I do, they also allow you to have a very easy bias based on something that I call projected defined ranges or PDRs. A very quick TL;DR of PDRs is that when you hit one level, you expect to go to the next one above you, or if you hold underneath a level, you expect to go to the next level below you. So, a very, very, very undetailed and nondescriptive description, which is, I guess, a little bit paradoxical of a saying, is that when you run into a high time frame level, you think that you're going to go to the next high time frame level. So, this is number two, and pillar three. So at this point, you have a liquidity sweep, which is your first pillar. Then you run into a high time frame level. Holding that high time frame level, sometimes getting above the halfway point, PDR sets into motion your internal bias. Now, I don't believe in daily bias. We do not trade based on daily bias with this setup. We trade off of very internal next move bias. So we're looking for the next move in the market. That may be the next 10 minutes. That may be the next hour. That may be the next 2 minutes of price. But whenever you hit a level, going to the next one is your immediate bias. So I believe in immediate bias, not daily bias. So again, so far the order is you have your liquidity sweep into your high time frame level, and then that high time frame level sets into motion your immediate bias, which is what sets into motion your Four Pillar stage. At this point, there's only one pillar left, which is how you get your entry or what we call internal confirmation. Now, again, like I said, the stage is set, and what I mean by the stage is set is that the Four Pillars setup, the first three pillars create what I call a stage. Imagine a stage is where something is hosted. Okay, for example, you go and you see a play. The stage is where the play is hosted. In this particular setup, in the Four Pillars Model, the first three pillars create the stage where your entries are hosted. So your PDR range or your bias level to level creates a range from here to here. And in this case, we would be looking long, right? We have a liquidity sweep into a high time frame level, which creates a bias. How do we actually long this? This is where we have our internal confirmation. Until price action reaches the completion of the PDR or the completion of the immediate bias, we can have as many internal confirmations as we want. And understand that your internal confirmation is your entry. So if 10 internal confirmations show up, we could take 10 trades on this entire Four Pillars setup. So the Four Pillars setup is really a stage for as many entries as it takes to complete the immediate bias. Hopefully that makes sense. Now, internal confirmation could be a lot of things. It could be the thing that held price down, breaking up and then having a retest. It could be as simple as, for example, if this is the liquidity sweep, price comes down and it can't get back underneath those lows. That could be internal confirmation to take a long. It could be something where you gain an order block. It could be turning a fair value gap inversion. It could be a whole hell of a lot of things, but as many times as it shows up, you could take it. It could be regaining a different level that's not involved in the bigger PDR or the bigger immediate bias. So, if you regain a level, you hold it. You could have internal confirmation here. You could have an internal confirmation as high up as here. As long as the bias has yet to be completed, you could have as many internal confirmations as you want. Now, that's theoretically how the Four Pillars Model works. The reason why I'm able to perform how I do perform is because of what I optimize for. Now, the third pillar, the bias, okay, that is what has the likelihood. That's where your probabilities lie. So the probability to go from level to level is about 70%. So think of that as the overall setup's expansion rate. That's not your trade's win rate. That's the setup. That's the stage completing in a way that you thought it was going to complete. That is the high probability. That's where you get your probabilities in the setup. On your actual entries, and on my actual entries, I do not care so much about the win rate of every individual entry. And here is why. For the most part, people thi...
00:13
Speaker A
pretty incredible if you compare those to almost any system in the space. The results don't even come close. And the reason that those statistics are able to be that high is because this is a very unique system. You will not see anybody
00:30
Speaker A
else on the internet trading like this and you won't see anybody else on the internet thinking about trading like this. So in today's video, we're going to put together the whole system. I have taught most of it for free on YouTube in
00:42
Speaker A
parts, but in this video we're going to be putting it all together, showing you how to use it day by day, and then also giving you some insight on the philosophy of the system and how to think about the market. So first and
00:53
Speaker A
foremost the name of my model is the four pillars model or the four pillars setup whatever you want to call it. Uh but the four pillars is the name it is because there's four distinct steps that you follow when you are utilizing this
01:09
Speaker A
model. Now this model covers everything from how you mark the levels to how you determine bias to how you actually enter as well. Uh, and the four pillars model kind of extends out to my general trading philosophy as well. And it talks
01:25
Speaker A
about how I value exposure over win rate and how I think about the market in a way that allows me to perform dramatically better than almost anybody in this space on a very consistent basis. And it's not just me. My students
01:38
Speaker A
do as well. I've at this point I've been doing this internet [ __ ] for a very long time. I've been trading for a very long time and a lot of people have learned from me and also had very similar
01:46
Speaker A
results. So, this video is going to go over it all and put it all together. The four pillars are as followed in this order. First and foremost, and the very first pillar is a liquidity sweep. So, if you're looking to buy the market, we
02:01
Speaker A
need a liquidity sweep underneath old lows. Or if you're looking to sell the market, we need a liquidity sweep above old highs. Now, this is very basic stuff. Everybody talks about liquidity sweep. This part of the setup is nothing
02:14
Speaker A
new, but we do need a liquidity sweep. And going forward when we talk about actually implementing this model, we'll talk about the very specific liquidity sweeps that we look for because not just any liquidity sweep will do. I'm not
02:27
Speaker A
looking as some random 1 minute level or 15-minute lows or whatever. I'm looking at very specific liquidity pools that need to be swept. Again, we'll go over those once we get into the actual execution part of this video. But for
02:40
Speaker A
now, the very first pillar and in your head, and remember, I'm telling you these in order. the order is more important than the position where you find these things. The order is more important. The very first step for this
02:54
Speaker A
model to show up is a liquidity sweep. If you're looking to buy the market, the market needs to run underneath prior lows. If you're looking to sell the market, the market needs to run above prior highs. Now, the second part of
03:06
Speaker A
this setup is your high time frame levels. Now, how I mark high time frame levels are very different than how many people do. We're going to have a brief rundown of them in this video, a brief overview of how I mark them in this
03:19
Speaker A
video. I have an entire video on my YouTube channel dedicated to high time frame level picking, but it is a mechanical process and it's the same thing every single day. So, this is a very mechanical way, but nobody marks
03:30
Speaker A
levels like I do. And when you do mark levels like I do, they also allow you to have a very easy bias based on something that I call projected defined ranges or PDRs. A very quick TLDDR of PDRs is that
03:44
Speaker A
when you hit one level, you expect to go to the next one above you or if you hold underneath a level, you expect to go to the next level below you. So, a very very very undetailed and nondescriptive
03:56
Speaker A
um description, which is I guess a little bit paradoxical of a saying, is that when you run into a high time frame level, you think that you're going to go to the next high time frame level. So, this is number two and pillar three. So
04:08
Speaker A
at this point you have a liquidity sweep which is your first pillar. Then you run into a high time frame level. Holding that high time frame level sometimes getting above the halfway point PDR sets into motion your internal bias. Now I
04:20
Speaker A
don't believe in daily bias. We do not trade based on daily bias with this setup. We trade off of very internal uh next move bias. So we're looking for the next move in the market. That may be the
04:30
Speaker A
next 10 minutes. That may be the next hour. That may be the next 2 minutes of price. But whenever you hit a level going to the next one is your immediate bias. So I believe in immediate bias not
04:40
Speaker A
daily bias. So again so far the order is you have your liquidity sweep into your high time frame level and then that high time frame level sets into motion your immediate bias which is what sets into motion your fourpillar stage. At this
04:56
Speaker A
point there's only one pillar left which is how you get your entry or what we call internal confirmation. Now again like I said the stage is set and what I mean by the stage is set is that the
05:08
Speaker A
four pillars setup the first three pillars create what I call a stage. Imagine a stage is where something is hosted. Okay for example you go and you see a play. The stage is where the play is hosted. In this particular setup in
05:23
Speaker A
the four pillars model the first three pillars creates the stage where your entries are hosted.
05:30
Speaker A
So your PDR range or your bias level to level creates a range from here to here.
05:36
Speaker A
And in this case, we would be looking along, right? We have a liquidity sweep into a high time frame level which creates a bias. How do we actually long this? This is where we have our internal confirmation until price action reaches the
05:50
Speaker A
completion of the PDR or the completion of the immediate bias. We can have as many internal confirmations as we want.
05:57
Speaker A
and understand that your internal confirmation is your entry. So if 10 internal confirmations show up, we could take 10 trades on this entire four pillars setup. So the four pillars setup is really a stage for as many entries as
06:13
Speaker A
it takes to complete the immediate bias. Hopefully that makes sense. Now internal confirmation could be a lot of things.
06:20
Speaker A
It could be the thing that held price down, breaking up and then having a retest. It could be as simple as, for example, if this is the liquidity sweep, price comes down and it can't get back underneath those lows. That could
06:32
Speaker A
be internal confirmation to take a long. It could be something where you gain an order block. It could be turning a fair value gap inversion. It could be a whole hell of a lot of things, but as many times as it shows up, you
06:44
Speaker A
could take it. It could be regaining a different level that's not involved in the bigger PDR or the bigger immediate uh bias. So, if you regain a level, you hold it. You could have internal confirmation here. You could have an
06:55
Speaker A
internal confirmation as high up as here. As long as the bias has yet to be completed, you could have as many internal confirmations as you want. Now, that's theoretically how the four pillars model works. The reason why I'm
07:11
Speaker A
able to perform how I do perform is because of what I optimize for. Now, the third pillar, the bias, okay, that is what has the likelihood. That's where your probabilities lie. So the probability to go from level to level is
07:27
Speaker A
about 70%. So think of that as the overall setup's expansion rate. That's not your trade's win rate. That's the setup. That's the stage completing in a way that you thought it was going to complete. That is the high
07:43
Speaker A
probability. That's where you get your probabilities in the setup on your actual entries. And on my actual entries, I do not care. so much about the win rate of every individual entry.
07:56
Speaker A
And here is why. For the most part, people think of win rate as the most important statistic in trading. The problem with this line of thinking is that when your win rate goes up dramatically, your riskto-reward on average goes down dramatically.
08:14
Speaker A
So what does that mean? If I have a 90% win rate, I might only take a one one trade. And you could do that with this setup, okay? You could play based off the about 75% chance that the the level
08:26
Speaker A
to level will complete and you could play a very small riskreward and have a pretty high win rate. The way that I like to do things is instead optimize for exposure. So, I'm going to give you some statistics right now, which might
08:38
Speaker A
be a little bit crazy to you, but my statistics in trading for the past half a decade have been 70% break even.
08:45
Speaker A
That is right. 70% of my trades go break even. 20% of my trades win and 10% of my trades lose. But when I win, on average I make over 10 R.
09:00
Speaker A
Okay, so that is a huge winner. If you talk to anybody in this space, most people are taking one to ones. Most people are taking one to 3es. This in my opinion is not so great. You could do
09:12
Speaker A
much better than this. And the reason is because we're getting a lot of free exposure. So what do I mean? I'm optimizing for entries that I can take where they're not necessarily likely to expand and I'm not necessarily likely to
09:23
Speaker A
win off them. They're not necessarily likely to complete the bias even, but they are very likely to get me at least break even. So, when I take an entry, I'm going break even as fast as humanly possible. So, we're talking about 1 to 2
09:38
Speaker A
seconds if my level holds at all. I'm going break even. And if I get break even, oh well, I take a break even. But my entries have very very tight stop- losses. So uh ultimately if I get lucky
09:51
Speaker A
and one of them runs I might make 10 15 20 risktoreward 20 R in a in a single trade. So, I figured if I can optimize for exposure in a move with tight stop- losses and I have an overall setup where
10:09
Speaker A
the range of expansion is highly probable and there could be many internal confirmations. There might be 20 internal confirmations on a move. If I could play all of those, even with these statistics, the odds are I'm going to get lucky and
10:24
Speaker A
one of these is going to run to an expected high probability range of expansion where my riskreward can be dramatically higher than it would be if I just took a big stop-loss position.
10:35
Speaker A
So, my adjusted win rate, if you remove break evens, is about 50 to 60%.
10:41
Speaker A
And my average win is 10R. If you do the math, this makes this system more profitable and has a higher expectancy than almost any system in the entire world. Now, I understand that that might seem too good to be true, but please
10:54
Speaker A
understand that I've been trading in this live in front of people. Every single position that I've ever taken for the last half a decade straight. There's real evidence behind this. And it's not just me who is having this kind of
11:06
Speaker A
statistics. It's also people that have learned from me. So, that's the philosophy of the four pillars. That's how every single pillar goes and that's the order that they need to come in.
11:18
Speaker A
Now, let's go over a couple days of real price action and real examples to show you the four pillar setup in action. And we're not just going to talk about examples that I didn't take and we're not going to cherrypick. We're going to
11:31
Speaker A
look at the last like five or so days of price action. I'm going to show you exactly what I actually traded. Okay?
11:38
Speaker A
And again, I didn't just trade these by myself or I'm just not pulling a thin out of the air. Hundreds and hundreds of people watch me trade these live in a Discord call real time. So, let's get right to the examples. All righty.
11:53
Speaker A
So, here is the very first example. This was literally yesterday. This is Friday. Again, I'm not cherry-picking. I'm not doing anything like this. These are going to be days sequentially in the past, okay? I'm not just going and
12:04
Speaker A
picking the best days that I've ever traded. This is going to be sequential days that I actually traded very recent price action. [snorts] So before market opens, what we do is we look for the easiest equal highs and the easiest
12:16
Speaker A
equal lows on the 15minute chart. Excuse me, I just burped while I was saying that. Whatever, bro. It doesn't matter.
12:24
Speaker A
We're looking for the easiest equal highs, the easiest equal lows on the 15 minute chart. And as you can see, I already have the high time frame levels marked out. If you want to know how to mark all the high time frame levels
12:33
Speaker A
perfectly, please go and watch the [ __ ] high time frame level video. Okay, this is a video putting it all together. You already have access to the high time frame level video. It's on the YouTube channel. Okay, so prior to price
12:44
Speaker A
action, right before market opens, we have the easiest equal highs up here. Okay, and we have the easiest equal lows right here. Right? This one and this one. They're equal. It's not necessarily equal, but this is how I determine this
12:58
Speaker A
high respected this high. So that means anybody who shorted here is going to have stop losses here. So there's liquidity. This low respected this low.
13:08
Speaker A
So people who are buying into the market here are going to have stop losses under here. So that's liquidity underneath here. Does that make sense? Very, very simple understanding liquidity and why we mark the highs and lows that we mark.
13:22
Speaker A
Okay. Now, let's drop down to the one minute chart because that's what I execute on. And this is where we wait.
13:27
Speaker A
Okay, this is where we wait. The market opens, it falls down into liquidity. We have our first pillar. Why? Because we swept liquidity and high time frame level, this 250 level. That's pillar number two. Does this set an emotion of bias? Yes,
13:47
Speaker A
because we trade level to level. So, we're at least at least expecting price to come up into this level. At most um at most we're expecting price to run up into the other side of liquidity.
14:00
Speaker A
Okay? Because that's often what happens. Price will go from one side of the easiest 15-minute lows to the other side of the easiest 15-minute highs or vice versa. Okay? So, at least we're looking for the run into the daily or into the
14:11
Speaker A
high time frame low here. At most, we're looking for the run into the opposing side liquidity. So that is three pillars already done as soon as this candle closes and as soon as we understand that this level's holding because now we have
14:23
Speaker A
a PDR bias, we have a liquidity sweep and we have a high time frame level. Now we need some sort of internal confirmation.
14:32
Speaker A
What can be internal confirmation? Well, the market pushes and look what it does. It holds above the liquidity sweep right here. Why is this internal confirmation?
14:44
Speaker A
Because if you watched the [ __ ] liquidity video, you would know that holding above the liquidity means that this is actually a sweep. So if this is our internal confirmation, this is also our entry and you could
15:01
Speaker A
take a long right there at the midpoint of this wick. Now I have an entire entries video as well that you could look through entries with as well. Just getting up into the easiest target, just the PDR completion would net you 8.9R
15:16
Speaker A
and getting up into the extended target or the other side liquidity would net you nearly 30 R. Again, it might seem too good be true, but I promise you this happens over almost every single day.
15:28
Speaker A
So, let's move on to the very next example. Again, we're not going super in-depth on each of these examples. If you want to go super in-depth, I post recaps of every single day that I trade on this YouTube channel. So, go back
15:39
Speaker A
onto YouTube after you're done with this video. Click on my videos and you'll see for the past while I've been posting a recap every single trading day. So, and where I deeply break down the four pillar setup here. I just want you to
15:50
Speaker A
get familiar with the process, familiar with what I'm looking for. So, let's go and we're going to look at the previous day. This is the very previous day to the example that we just looked at. And I want you to find the easy super highs
16:04
Speaker A
right before market open right here. Okay, these are the easy super highs. We're just going to mark these uh blue.
16:09
Speaker A
I guess that's fine. Or uh let's let's just do green. Okay. And then the easiest equal lows before the market opens. Okay. Well, we have these lows right here. Why would these lows be good? Can you answer that? Yes or no?
16:24
Speaker A
Uh I would say yes. They they are pretty good because after this liquidity sweep, anybody who bought up thinking that this was just going to run the lows is now putting their stop loss underneath here, right? And the market hasn't opened. So,
16:35
Speaker A
it's stupid. Their their thing is going to get swept. Their liquidity is going to get swept. Their stop loss is going to get ran. So, we have the easy lows and the easiest highs, the easiest liquidity on both sides. We can play the
16:46
Speaker A
market and then we could drop down to a one minute chart here and look at what happened. So, the market opens. We have no liquidity sweep yet. There's nothing yet. There's no liquidity sweep yet. There's still no liquidity sweep. When does the thing set
17:04
Speaker A
in motion? When we have a liquidity sweep, here's your liquidity sweep. Now, it pushes up. Did we have a high time frame level? The answer is [ __ ] no, we did not. Okay. When do we get the
17:14
Speaker A
next high time frame level test? Right here. The market trades into your high time frame level. Two. Now, we have liquidity sweep level testing. Does that set an emotion of bias? The level holds down to here. This is the very next high
17:28
Speaker A
time frame level. So, at this point, we have a bias down into at least this level at most down into the opposite side of liquidity. Cool. So, we have three. We have three of the four pillars. What's the fourth pillar?
17:40
Speaker A
Internal confirmation. Okay, you understand? Yes, you do. Hopefully, you do. Otherwise, I don't know what the [ __ ] to say to you, brother. I don't know what the [ __ ] to say to you. Um, where's our internal confirmation on
17:52
Speaker A
this trade? Okay, a couple places could do. First and foremost, we have this wick right here that gets closed under in this candle. You could take a short position right here with a stop loss right above that wick
18:08
Speaker A
down to the very first high time frame level or PDR completion, you would make 10R and down to the opposing equal lows, you would make almost 30.
18:20
Speaker A
You're seeing a pattern here. And and it might seem too good to be true, like, oh, you wouldn't know to take this level. You wouldn't know to do this or that. You very well could um if you wanted to play it safer, you could even
18:31
Speaker A
short the order block right here, right? You could short it when it comes up into this one minute order block, a stop-loss uh above the high.
18:40
Speaker A
And at this point, you would only make 5.3R to the easiest target or, you know, a little bit over 12 uh to the lowest target, which is opposing liquidity. But this is the trade that I'd be more likely to take. And this is close to the
18:52
Speaker A
trade that I actually did take. Okay? And if you miss that, there's more opportunity here because we have another version of internal confirmation right here. This is a more clean version of internal confirmation where price can no longer get above the liquidity that we
19:05
Speaker A
swept, meaning that this was actually a sweep. So if we have anything inside of this range, we can take it short. So anything you find inside here, you could short it or you could wait for the next level to lose, you could short right
19:16
Speaker A
when it tests up into these levels. Anything in here, taking it down where down into the opposing liquidity. That could be your four-pillar setup. So do you understand? And are you seeing how these four pillar setups are actually
19:28
Speaker A
going? All right, here's the next day. And right before the market opens, where's the easy equal highs and where's the easy equal lows? Very, very simple.
19:35
Speaker A
Okay, look, we're looking at these highs. Why? Because this respected this. This is the easiest equal highs. We're looking at these lows. Why? Because this respected this. So, we're looking at these lows. Drop it down. Okay. Let it
19:47
Speaker A
play out. Okay. Um, it doesn't matter. We could we could play down to one minute at this point.
19:59
Speaker A
And let's look at the position that we might have been able to take. So, this was a bit of a choppy day, I will say.
20:07
Speaker A
We have the market opening right here and we run up and we rush into the highs. Now, on this particular day, the market plummets down. It misses the very next level. I would argue there's no internal confirmation here because
20:23
Speaker A
because there's no regaining of the next high time frame level. So this is this is going to be example where the the four-pillar setup was kind of hard to play or you might even take it you might have even taken a loss or two. Okay,
20:35
Speaker A
but we did run the highs first. So we understand that overall in the day we're we're going to be bearish, right? We're going to be looking for the price to roll over um for the most part.
20:46
Speaker A
Price runs again. It trades into the high time frame level right here. At this point price falls, but what does it do? It's stalling and it's staying above the old equal highs. Is this a long? No. Why? Because it's staying
21:00
Speaker A
above the old equal highs. It's not getting below them. We expect price to run the high again. Read my reading price action videos if you haven't.
21:07
Speaker A
Okay, it does run the high again. Okay, inside of here, if you took a trade inside of here short, I wouldn't mind it. And you you honestly might be fine.
21:20
Speaker A
Uh that that that's the first valid setup that I see because at that point we ran the we ran the equal highs, we held over the highs, we ran the next high uh where that black line is and
21:31
Speaker A
then we regain a high time frame level. There's probably a four-pillar short in here somewhere. If he took it and he took a loss, so well, so sad. It pushes up again. We run the highs. Is there a
21:41
Speaker A
four-pillar short yet? No, because we come down and guess what we hold? We hold the [ __ ] things. We hold the things. There's nothing here for us.
21:50
Speaker A
Uh we do have a PDR level between these two dailies, but there's nothing [snorts] here for us. Okay? Nothing here for us at all until look at what happens right here.
22:02
Speaker A
At this point, we keep running highs and now we've lost the big daily level.
22:07
Speaker A
Right inside of here is where we actually potentially have a real trade to take. Uh coming in in these positions right here. The market holds the high time frame level, goes up to the next one, but it's losing everything. It's
22:23
Speaker A
losing all the daily levels just like it did back here. So, we don't I would I would argue that we actually don't have anything yet. Um, I would probably want to wait for us to actually lose underneath 2914, which is that liquidity
22:37
Speaker A
sweep. We do. Let's look for the wick. That's the breakout wick of this range.
22:42
Speaker A
A lot of people would look towards this. There's an older one. This is crazy, but it's actually this one is your breakout wick. Um, the reason it's this one is because this holds majority of price action. So, it can't be this one because
22:55
Speaker A
this wick is holding this one. This wick goes through, this wick goes through. It's this one right here. So, that's your internal confirmation short. Okay, that's your internal confirmation short.
23:05
Speaker A
Uh, and even writing this down into the next high time frame level is going to be a [ __ ] ton of R because the stop loss is stupid. Even to the next high time frame level is 34R. If you wanted to
23:15
Speaker A
hold this out and try to get like way the [ __ ] down here, uh genuinely this is 173R.
23:23
Speaker A
Um nobody's going to hold this trade that long, but that that's how you would take it. Anyways, it's the four pillars, right? This is a four pillar short down to the next one, down to the next uh liquidity. So, it shows up like this
23:35
Speaker A
almost every single day. I live trade it like this almost every single day. Uh and that's that's how it goes. So that's it. That's the model that changed my life and has made me over $45 million in the markets. Now, that money is not
23:52
Speaker A
necessarily just scalping. I also have long-term investment accounts. That that number is kind of a clickbait title, okay? If I didn't invest my money that I made from trading, I wouldn't have anywhere near that amount. Uh some of it
24:04
Speaker A
is other accounts, some of it's investing, buying gold at a really smart time. But I made a huge amount of money from just trading as well. And all those trading profits got put into investments which made me more money. So I'm going
24:13
Speaker A
to click bait with the [ __ ] 45 $50 million. Okay. Um and I don't exactly know how much it's made me because the number fluctuates by hundreds of thousands and on some days millions of dollars a day. So who knows? But that's
24:27
Speaker A
it. High time frame levels, liquidity sweeps, projected fine range biases and internal confirmation. every single trade I take, every single trade that I have took since I became profitable. Now, this is just a YouTube video and so I went into
24:42
Speaker A
as much detail as possible, but in order for you to replicate this the same way I do, you're going to have to spend more time working with me. So, if you want to go beyond just knowing the model and
24:52
Speaker A
actually learn how to execute it dayby day, correct level selection, reading PDRs in real time, and knowing which internal confirmation to use and when, that's what the four pillars mentorship is for. The wait list is open right now.
25:07
Speaker A
Spots are very, very limited and weight list members will get first access when enrollment opens. So, the link is in the description and join the weight list.
25:16
Speaker A
With that being said, hopefully this video helped a bunch of people. If it did, leave a like, comment, and I'll see you guys tomorrow or a different day.
25:24
Speaker A
Probably tomorrow for the recap.
Topics:Four Pillars Modeltrading strategyliquidity sweephigh timeframe levelsimmediate biasinternal confirmationprojected defined rangesday tradingprice actiontrading psychology

Frequently Asked Questions

What is the Four Pillars Model in trading?

The Four Pillars Model is a trading system consisting of four steps: liquidity sweep, high timeframe levels, immediate bias, and internal confirmation. It guides traders on when and how to enter trades based on these pillars.

How does the Four Pillars Model determine trade entries?

Trade entries are determined by internal confirmations, which are price action signals occurring within the stage set by the first three pillars. Multiple entries can be taken as long as the immediate bias has not been completed.

Why does the strategy prioritize exposure over individual trade win rate?

The strategy focuses on exposure because the overall setup has a high probability (around 70%) to complete its bias, allowing multiple entries. This approach maximizes profit potential despite individual trades having varying win rates.

Get More with the Söz AI App

Transcribe recordings, audio files, and YouTube videos — with AI summaries, speaker detection, and unlimited transcriptions.

Or transcribe another YouTube video here →