Fair Value Gaps Explained — Transcript

Learn how to identify and use bullish and bearish fair value gaps in trading, including inversion gaps and key levels within them.

Key Takeaways

  • Fair value gaps help identify potential support and resistance zones based on candle wick gaps.
  • Price closing through a fair value gap causes inversion, changing its role from support to resistance or vice versa.
  • Internal levels within fair value gaps provide nuanced areas for price reaction and trading decisions.
  • Overlapping inversion and normal fair value gaps require prioritizing the inversion gap for analysis.
  • Proper management of fair value gaps on charts improves clarity and trading effectiveness.

Summary

  • Fair value gaps are a foundational technical analysis tool used daily in trading.
  • A fair value gap is a three-candle pattern where gaps between candle wicks define bullish or bearish gaps.
  • Bullish fair value gaps form when candle 1's top wick and candle 3's bottom wick have a gap, acting as support.
  • Bearish fair value gaps form when candle 1's bottom wick and candle 3's top wick have a gap, acting as resistance.
  • If price closes through a fair value gap, it can invert and act as resistance or support opposite to its original role.
  • Fair value gaps contain three internal levels: halfway, 25%, and 75%, which are important for price action analysis.
  • Inversion fair value gaps are prioritized over normal gaps when overlapping at the same price level.
  • Fair value gaps should be removed from charts once price closes back above or below them after inversion.
  • Special cases include gaps in candle bodies, which should be included inside the fair value gap boundaries.
  • Understanding and identifying fair value gaps is critical before applying more advanced strategies like PDR.

Full Transcript — Download SRT & Markdown

00:00
Speaker A
Today, we're going to be talking about fair value gaps. One of the foundational parts of technical analysis, at least in the way that I do it, and something that you're going to be utilizing every single trading day. All right, before we
00:10
Speaker A
get to that chart example, let's talk about fair value gaps and how to define them. What you're looking at right here is a bullish fair value gap. All a fair value gap is, is a three-candle pattern.
00:21
Speaker A
You have candle one, you have candle two, and you have candle three right here. And in a bullish sense, the fair value gap appears when candle one's top wick and candle 3's bottom wick have a space between them. Okay? So, if you
00:41
Speaker A
draw a line at candle 1's top wick and you draw a line at candle 3's bottom wick, there is a space between those two points. Now, if these candles look something like this, if the candles look something like this, you'll notice that
00:57
Speaker A
if you draw a line from candle one's wick over, candle 3's wick intersects it. So, there's no fair value gap here.
01:04
Speaker A
Fair value gap exists when candle one top wick and candle three bottom wick have a gap between them. And then you take that section of price, you extend it out in time, and that should become your bullish fair value gap. And ideally,
01:18
Speaker A
when price returns back into that range, it should be used as support in a bullish market to continue trading higher. And then we have more or less the same thing with a bearish fair value gap. Again, it's just a three-candle
01:30
Speaker A
pattern. We have candle one, we have candle two, we have candle three. Where if you draw out candle one's bottom wick and candle 3's top wick, if there's a space in between, that's going to be your fair value gap, your bearish fair
01:44
Speaker A
value gap, where if price comes back up into that range, you would expect it to sell off in a bearish market. In the case that these two wicks both cross each other like so, there's no fair value gap here because if you draw out
01:59
Speaker A
candle 1's first wick, candle 3's wick overlaps there. There's no space in between. Okay? So, there's no fair value gap here. Fair value gap, a bearish fair value gap in this case only exists when you draw candle 1's bottom wick and
02:11
Speaker A
candle 3's top wick and there's a space in between them. Drag that out of time. That's your bearish fair value gap that you would expect to act as resistance in a downwards trending market. So let's now work
02:25
Speaker A
through this example quickly identifying the fair value gaps. Now this video is going to go into quite a bit more detail than just identifying them. But we need to be able to identify them before we could go into that detail. So
02:35
Speaker A
if we start at the very beginning and we push higher, usually fair value gaps form on aggressive moves. So, we have a push higher in the market and we do have a fair value gap that formed right here,
02:47
Speaker A
right? Because we have the candle one's top wick and candle 3's bottom wick creating a gap of space. Drag that out in time. This becomes a bullish fair value gap. Do you see that? Price comes down into it. Price pushes away higher.
03:02
Speaker A
Now, if we continue going, the next fair value gap that gets formed right here gets created right here. And this time, price doesn't really react to it.
03:11
Speaker A
Instead, price falls right through it and closes. This brings us into how fair value gaps turn to what we call inversion fair value gaps. So, if you have a bullish fair value gap, if it gets closed under, look towards that now being able to be
03:28
Speaker A
used as resistance as a bearish fair value gap. So if this was bullish in the beginning, the second that a candle of the same time frame closes underneath it, it could be used as something to short the market. Now, the market
03:42
Speaker A
falls off of it. And then the market falls down, it closes under this, it closes underneath this fair value gap.
03:49
Speaker A
And you'll notice price comes up, holds, price retests the halfway point of it, and sells off. And this is a good time to mention that every fair value gap has three levels inside of it. We have the halfway point, we have the 75% level,
04:07
Speaker A
and we have the 25% level. So, these are just levels inside of a fair value gap.
04:11
Speaker A
I'm not going to mark these on every single fair value gap, but just realize that these are there. We will talk about these a lot more when we get into the PDR section of this boot camp. So, price action can go to the halfway
04:24
Speaker A
point, it could go to the 25%, it could go to the edges. The point being is this whole range is a fair value gap. And when it gets closed under like it does here, like it does here, they could be
04:34
Speaker A
used as inversion. Okay? So on one side they're used to hold the market up, right? And this one very well could have held the market up too, like so, but it decided to get closed under. And when it
04:45
Speaker A
does close under, it can now act as an inversion fair value gap. Okay? As price continues here, price closes back above this fair value gap. This is the point where you would remove it off of your chart. So inside
05:01
Speaker A
of this candle right here, this is when you would remove this fair value gap off your chart. It was a bullish fair value gap. It turned inversion on the close, it got respected and then it got closed back above. Once it gets closed back
05:14
Speaker A
above, once an inversion fair value gap gets closed, that's when this is no longer on your chart and is no longer useful to your analysis and to your trading. Okay, hopefully that makes a lot of sense.
05:29
Speaker A
And then this fair value gap gets continued to be used as an inversion fair value gap alongside a normal bearish fair value gap that gets created right here. Okay, as you can see, we have a bearish fair value
05:44
Speaker A
gap that gets created and we have an inversion fair value gap. Both at the same price level. Is there anything notable about them both being at the same price level? Absolutely not. Some people will tell you different. I'm
05:55
Speaker A
telling you there's no difference. You could use the inversion one, you could use the normal bearish one. Most of the time if an inversion fair value gap overlaps a normal bearish fair value gap, I'm going to prioritize the
06:09
Speaker A
inversion fair value gap until the normal one turns inversion. Okay, then price closes over it. This is when we take it off our chart.
06:21
Speaker A
Right now this fair value gap that was inversion turns bullish. How? So this was used to short the market. This was used to hold the market down first. But now that price has closed over it, this previously bearish fair value gap that was holding
06:41
Speaker A
the market down is now being utilized to hold the market higher and hold the market up. Okay. So this is the very basics of how we read fair value gaps and how we identify them. As you could see, bullish fair value gaps hold the
06:56
Speaker A
market up in uptrends until they turn inversion. Then they turn into bearish fair value gaps that could hold the market down at reversals or in downtrends. Bearish fair value gaps form and are utilized to hold the market down
07:10
Speaker A
in bearish markets until they turn inversion and then they become bullish fair value gaps that could be used to hold the market up at reversals or inside of uptrends. Now, let's talk about one little edge case
07:24
Speaker A
that might trick you up sometimes, and that's if you have candles that look like this. Okay? And we'll talk about what these gaps are used for because they're actually useful in a different video very soon inside of this boot
07:37
Speaker A
camp. But if you have a fair value gap where normally you would mark this fair value gap like so from the wicks, if the candles gap like this and they're connected to the candles of that fair value gap, you want to be sure to
07:53
Speaker A
include those gaps inside of the fair value gap only in that case. Okay. So now your fair value gap would look like this.
08:01
Speaker A
Okay. If there are no gaps in bodies, if there's no gaps in bodies at all like so, then your fair value gap is drawn from the wicks. And it would be the same thing on the opposite side, right? Like
08:14
Speaker A
if I had a gap in the body like this, then I would draw my fair value gap from the body gap right here to the top.
08:29
Speaker A
it would still be like this on the inverse side. Uh and again, just remember for now that fair value gaps have three levels inside of them. Very often you'll see price go to the halfway point and uh treat inversion fair value
08:42
Speaker A
gaps just the same as you would treat any other fair value gap. The second it turns inversion is just a bullish fair value gap. The price could easily come to the halfway point, could easily come to the 25% level, it could easily go to
08:53
Speaker A
the bottom. Again, we will have a video very shortly on something called projected defined ranges where these three levels inside the fair value gap become incredibly useful for bias.
09:03
Speaker A
So now let's talk about a question that I get often and that's if you have two fair value gaps on top of each other. As you can see in this particular price example, I'm going to close this body so
09:13
Speaker A
it's a little bit simpler for us. In this particular price example, we have one fair value gap here and we have one fair value gap right here. And a lot of people, let's say price is trading right here. They'll ask me the question of
09:27
Speaker A
which one is price going to trade into. Is it going to trade into the first one?
09:31
Speaker A
Is it going to trade into the second one? So, as a general rule of thumb, if there is two fair value gaps in a move up or basically just any more than one.
09:41
Speaker A
They could be three, four, five, six, seven, it doesn't matter. the very first fair value gap that gets created in a move. Typically, if it stays open, so if price doesn't trade down into it, you're going to get
09:55
Speaker A
a much more aggressive move out of the range. And typically, that leads to range expansions, ranges breaking, and uh trends starting in the market. Okay?
10:06
Speaker A
If price action trades into it, it doesn't mean it can't be aggressive. It just means it's more likely to reach this high and maybe come back down and just chop around for a little bit and just chop and chop until something at
10:21
Speaker A
the bottom of move does get left open like in this example right here. Then that's typically the aggressive sign that a market is ready to accelerate quickly. So leaving a fair value gap open at the bottom of the market is
10:35
Speaker A
often an indication for aggression because people are willing to buy the top fair value gap. They're not even willing for it to go to the bottom one which typically leads to very aggressive pushes inside of a market. Now let's
10:50
Speaker A
talk about a situation like this where we had those two fair value gaps and a candle comes down and closes underneath both of them. Which inversion fair value gap are we going to use? Are we going to use the higher one or the lower one?
11:02
Speaker A
Well, some people would just use both of them. I would be a very strong arguer of only using the one that held the most price action. So, as you could see, the top one held price action one time, two
11:17
Speaker A
times, three times, four times. The bottom one here never held price action at all. So, the more important inversion fair value gap here is going to be the one that held price action the most. So, I would be looking at this one to hold
11:31
Speaker A
price down. It doesn't mean that this one cannot hold price down, especially if you have a higher time frame level or a different confluence here. But it just means that if we're looking at this chart directly, this inversion fair
11:44
Speaker A
value gap is more likely than this one. Okay? And in the case that the candles look like this, for example, which by the way would be a really rare case, but I I suppose it could happen. In this
11:56
Speaker A
case, because they both held price action the same amount, I would actually use the lower one in this example uh instead of using the higher one. In this case, I would use the lower one. Well, in this particular case, it would it
12:08
Speaker A
would have to look something more like this. So that there actually is a higher higher fair value gap. But in this case, if they both hold price action an equivalent amount of time, I'm going to use the lower one. And really, this is
12:20
Speaker A
it to fair value gaps. Um, at least defining them and identifying them and talking about some of the niche cases with them. Um, we will talk about how to enter off of fair value gaps in another video inside of this boot camp. We will
12:32
Speaker A
talk about higher probability fair value gaps because there's a lot of fair value gaps that show up on a chart and not all of them work. We'll talk about when to use fair value gaps, their uh ability to
12:42
Speaker A
predict rangebound markets and non-rangebound markets in all of this in a future video, but for now, you need to be worried on how do I define them? How do I look for them? And can I get good at just spotting them, okay? Don't worry
12:55
Speaker A
about using them yet. Get good at spotting them. Learn how to define them on a chart. And as soon as we're done with this technical analysis section in this boot camp, we will get into how to utilize these things to form a proper
13:07
Speaker A
trading strategy uh that you could actually execute on every single day. So I'll see you guys in the next boot camp video. And this is a pretty simple explanation, albeit fairly basic, of fair value gaps.
Topics:fair value gapstechnical analysistrading strategybullish fair value gapbearish fair value gapinversion fair value gapprice actionsupport and resistancecandlestick patternstrading education

Frequently Asked Questions

What is a fair value gap in trading?

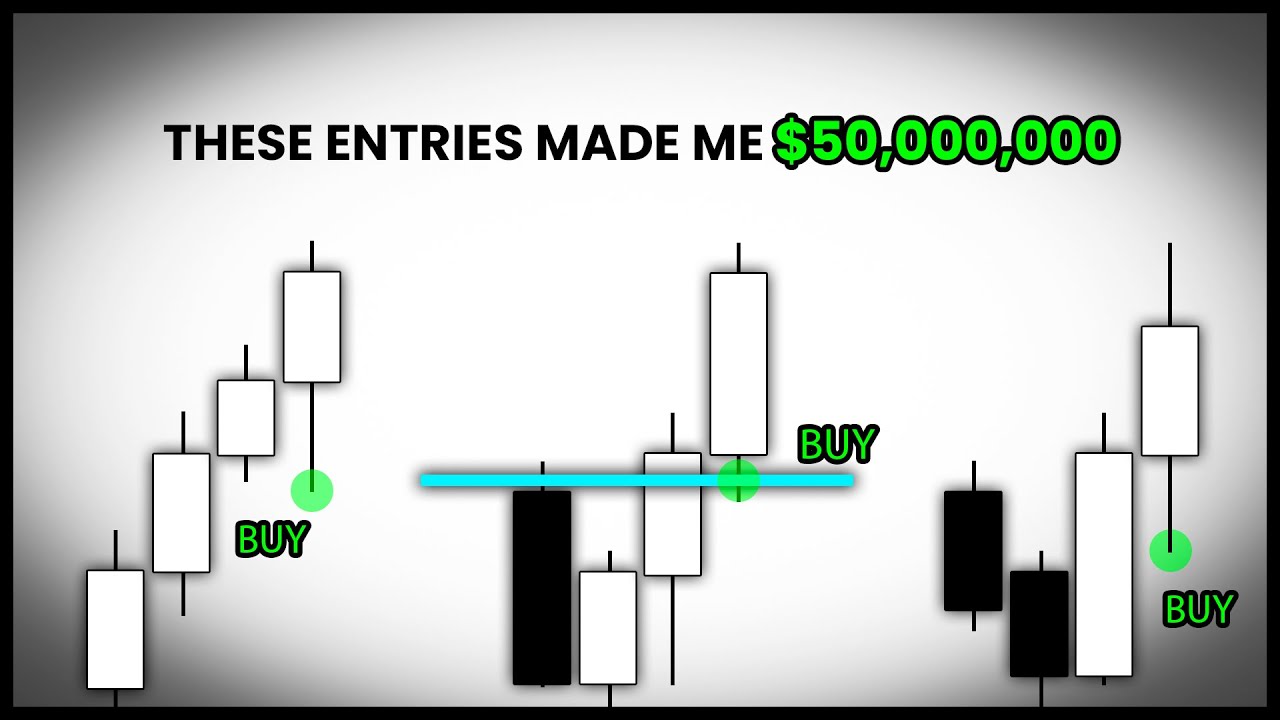
A fair value gap is a three-candle pattern where a gap exists between candle 1's wick and candle 3's wick, indicating potential support or resistance zones.

How does an inversion fair value gap work?

When price closes through a fair value gap, it inverts its role, turning a bullish gap into a bearish resistance zone or vice versa, which traders can use for potential entry or exit points.

What are the key levels within a fair value gap?

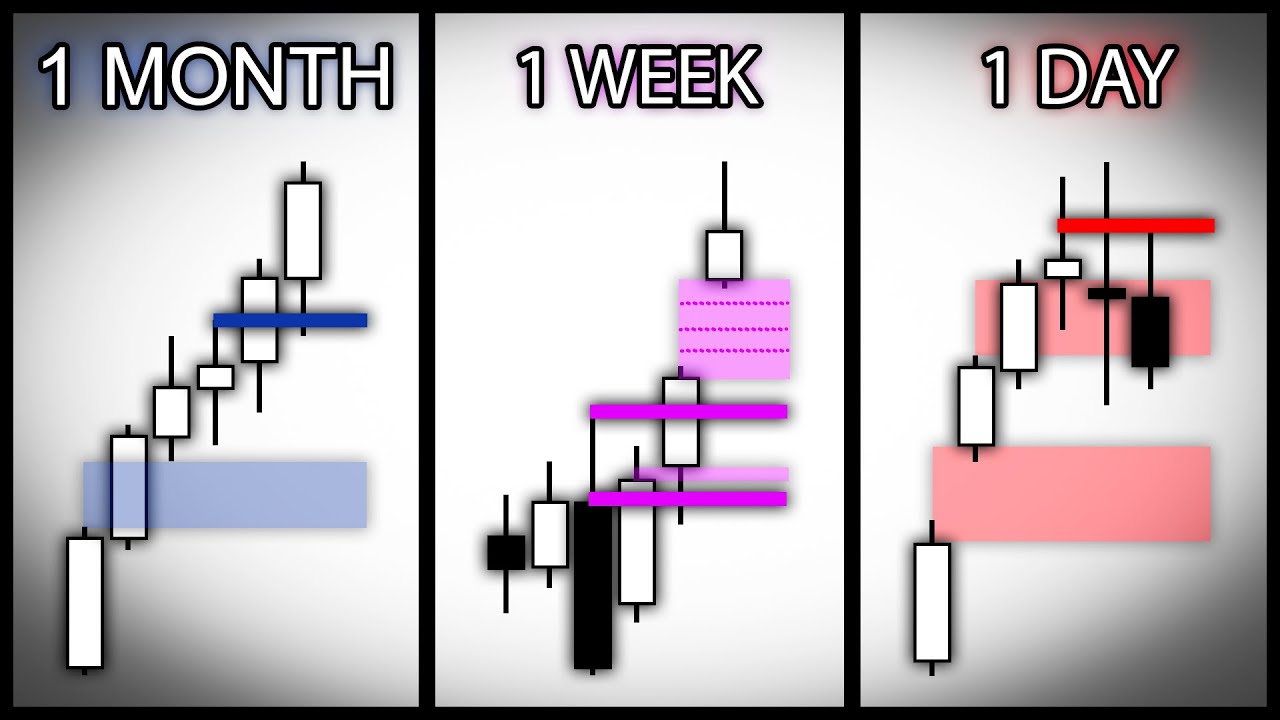
Each fair value gap contains three important levels: the halfway point, the 25% level, and the 75% level, which help traders identify where price might react within the gap.

Get More with the Söz AI App

Transcribe recordings, audio files, and YouTube videos — with AI summaries, speaker detection, and unlimited transcriptions.

Or transcribe another YouTube video here →