The ULTIMATE Beginner’s Guide to SUPPLY & DEMAND — Transcript

Learn the fundamentals of supply and demand trading, market equilibrium, and price action in this beginner-friendly guide by Fractal Flow.

Key Takeaways

  • Supply and demand trading is grounded in fundamental economic laws.
  • Market prices fluctuate as supply and demand curves shift, seeking new equilibrium points.
  • Understanding buyer and seller behavior is crucial for predicting price movements.
  • Technical analysis combined with economic principles enhances trading effectiveness.
  • Price reflects market equilibrium attempts, while value is subjective perception.

Summary

  • Introduction to supply and demand trading as a powerful technique based on economic principles.
  • Explanation of the law of demand: higher prices lead to lower quantity demanded.
  • Explanation of the law of supply: higher prices lead to higher quantity supplied.
  • Visualization of supply and demand curves and their slopes on price-quantity graphs.
  • Concept of market equilibrium where supply equals demand and price stabilizes.
  • Discussion of the market's natural tendency to seek equilibrium through the 'invisible hand'.
  • Explanation of supply and demand shifts causing price changes in financial markets.
  • Distinction between price (numerical value) and value (perceived worth by buyers and sellers).
  • Integration of supply and demand laws with technical analysis and price action for trading.
  • Examples of the technique's success and failure in real price charts for practical understanding.

Full Transcript — Download SRT & Markdown

00:00
Speaker A
In this free video course, I'm going to show you the basics of supply and demand trading in a simple and straightforward way. Supply and demand trading is perhaps one of the most powerful trading techniques because it's directly built on one of
00:14
Speaker A
the most important ideas found in economics, which is the law of supply and demand. This law is what regulates the behavior of buyers and sellers, not just in the financial markets but in all markets you can imagine, so it's obviously in every trader's
00:29
Speaker A
interest to learn how supply and demand works in the context of technical analysis and price action reading. Before we begin the video, I would like to politely ask that if you are new to the channel, you hit the like button and subscribe.
00:42
Speaker A
It's only a small gesture on your part, but it makes a tremendous difference for the channel. I guarantee you will not be disappointed. In this video, you will learn how the law of supply and demand works, how it controls all markets, how, why,
00:57
Speaker A
and when prices rise or fall, what happens with supply and demand when price reverses direction, and how to use the supply and demand technique in trading. So without further ado, let's begin talking about the supply and demand technique.
01:11
Speaker A
There are two sides of the supply and demand technique when it comes to price action trading. We first must apprehend how the law of supply and demand works, which is an idea from economics, and then we must align this idea with the basic
01:24
Speaker A
premise of technical analysis and price action reading, which is that we can use the recent past of price to understand its near future. Without these two elements combined together, it's impossible to use the supply and demand technique effectively.
01:38
Speaker A
There is no question about the validity of the law of supply and demand, as it is widely used by economists to analyze all sorts of situations that happen in the economy. However, there is some debate about the basic premise of technical analysis and
01:53
Speaker A
price action reading, as we'll see later in the course. We'll first break down the law of supply and demand to understand how the idea of market equilibrium works, and then we'll combine that with the basic premise of technical analysis and
02:06
Speaker A
price action so we can use the concept of supply and demand to speculate about the near future of price in light of the recent past. We'll also observe examples of this technique working and failing in real price charts,
02:19
Speaker A
so you can have a good idea of what to expect when you study charts yourself. Just as a reminder, this video is made for educational purposes only, like all the other videos on the channel and the courses I provide.
02:32
Speaker A
Use these techniques at your own risk. Before learning what the law of supply and demand is, we must first apprehend the law of demand and the law of supply individually, and even before that, we must apprehend that demand relates to
02:46
Speaker A
buyers and supply relates to sellers. That's because buyers demand or seek products, services, or financial assets. Sellers provide or supply products, services, or financial assets. In summary, when we talk about demand, we are talking about buyers. When we talk about supply, we are talking
03:06
Speaker A
about sellers. The law of demand claims that the higher the price of something, the fewer buyers will demand it. That makes perfect sense, even for people who don't know what the law of demand is. The higher the price of something, the
03:20
Speaker A
less willing you are to buy it because you want to spend the least amount of money possible for obvious reasons. You don't want to pay more than what you really need to in order to get something. This is precisely why more expensive
03:33
Speaker A
items are sold in lower quantity. They have a much higher price, so there are a lot fewer people willing to buy them. There are other factors at play here, of course, but the law of demand is a big
03:45
Speaker A
part of the explanation. Using the jargon found in economics, the law of demand states that the higher the price, the lower the quantity demanded of an item. We can visualize the law of demand using a simple graph. On the x-axis, we have the quantity
04:00
Speaker A
demanded, and on the y-axis, we have the price of an item. The higher the price, the lower the quantity demanded, so the demand curve is a down-sloping line. The law of supply, on the other hand, states that the higher the price of
04:14
Speaker A
something, the more sellers will be willing to sell it. This is also an obvious thing, even for those who are not aware of the law of supply. The higher the price of something, the more money you can make by selling it.
04:29
Speaker A
Using the jargon found in economics, the law of supply claims that the higher the price, the higher the quantity supplied of an item. We can visualize the law of supply using a simple graph. On the x-axis, we have the quantity supplied,
04:43
Speaker A
and on the y-axis, we have the price of an item. The higher the price, the higher the quantity supplied, so the supply curve is an up-sloping line. Given these two separate definitions, we must now combine them to understand the
04:57
Speaker A
law of supply and demand and the notion of market equilibrium. The law of supply and demand states that price will always seek the market equilibrium, which is the point where the supply and demand curves cross each other. In other words, when the quantity that
05:11
Speaker A
all buyers want to buy is equal to the quantity that all sellers want to sell, the price of this market will be at equilibrium, meaning that it doesn't change because there is no motivation to do so. When the supply and demand curves move,
05:24
Speaker A
the point of equilibrium will change. Then price will seek this new equilibrium naturally. We can once again visualize that by plotting the supply curve and the demand curve on the same graph. Rather intuitively, the market equilibrium occurs at the point where
05:39
Speaker A
the supply and demand curves cross each other. This is the quantity that will satisfy both buyers and sellers in the market at that price. In other words, when the market is in equilibrium, prices don't change because buyers don't have the motivation to buy
05:54
Speaker A
more or buy less, and sellers don't have the motivation to sell more or sell less. All market participants are satisfied in a way. Another very important notion is that any market will always seek the equilibrium naturally. This is what Adam Smith called
06:10
Speaker A
the invisible hand of the market. In other words, a market has a self-correcting mechanism that automatically adjusts the price of whatever is being traded according to the free will and self-interest of buyers and sellers. This is, of course, a reflection of human
06:26
Speaker A
nature and not a consequence of some arbitrary rule. In other words, when you let people trade freely according to their self-interest, a market economy and the law of supply and demand emerge naturally. This point where the supply and demand
06:39
Speaker A
curves cross each other is called the point of equilibrium, and at this point, price remains constant because buyers and sellers don't have motivation to buy or sell less or more. However, you must have noticed by now that price is hardly ever
06:53
Speaker A
at an equilibrium, meaning that it is constantly changing in the financial markets. So you might be asking yourself, what causes prices to change? The answer to this question is something called supply and demand shifts. The number of buyers and sellers and
07:07
Speaker A
their willingness to buy or sell something is constantly changing. In the financial markets, buyers and sellers are always speculating about whether or not a market is undervalued or overvalued. There are literally hundreds of variables that affect that judgment. When buyers or sellers change their
07:24
Speaker A
perception about a market, the perception shifts the supply and demand curves, so the market will seek a new equilibrium. Here, it's also useful to understand the difference between price and value. Price is just a number that you see on
07:38
Speaker A
the screen, which is the current result of a market trying to seek its equilibrium. The value is how buyers and sellers perceive price. This perception of value is what causes supply and demand shifts and makes price move up or down. In the
07:53
Speaker A
end, the perception of value about a market changes first, and then the market seeks the new equilibrium.
08:09
Speaker A
the demand in that market will increase meaning that buyers will be willing to buy more of the same thing at a given price and that causes the demand curve to move to the right automatically a shift to the right in
08:22
Speaker A
the demand curve will cause the new market equilibrium to be at a higher price because the point of equilibrium which is the point where supply and demand curves cross each other will suffer a movement up the supply curve
08:35
Speaker A
remember that sellers want to sell at the highest price possible so if buyers are willing to buy more at the same price sellers will increase price to adjust the new demand to the current supply this is an example of a demand shift
08:49
Speaker A
that causes price to rise in the same way for whatever reason sellers become more willing to sell in a particular market therefore causing the supply curve to move to the right price will go down as a result of the
09:03
Speaker A
point of equilibrium suffering and movement down the demand curve this is the underlying mechanism in all markets you can imagine not just in the financial markets it's the basis of a market economy these two examples we saw an increase in
09:17
Speaker A
demand and an increase in supply but of course there can be a decrease in demand and a decrease in supply as well the main point is that by visualizing the supply and demand curves we can understand why supply and demand
09:30
Speaker A
shifts motivate buyers and sellers to produce movement along the curves ultimately altering the market price this concludes the first part of the course where we dive a little deeper into the idea of supply and demand now we need to align what we learned with
09:45
Speaker A
the basic premise of technical analysis and price action reading this premise states that we can use the recent past of price to understand or predict what's going to happen in the near future of price another way of looking at this is that
09:59
Speaker A
we can find repeatable and therefore exploitable patterns in price without this premise anything about technical analysis and price action falls apart so if we want to continue we need to assume this is true which it is but you have to be careful here i say
10:15
Speaker A
that because even though this is true it's not true all the time it's true only when there are not other stronger forces acting on price for example technical analysis and price action techniques and methods tend to work when the market is in a
10:29
Speaker A
certain state of normality when there are dramatic events affecting the market like major news or major macroeconomic forces technical analysis and price action reading tend to be distorted or they tend to become unreliable this is why sometimes we will do everything
10:46
Speaker A
right in terms of technique and your trades will still fail however that's a subject for another video or perhaps another course for the purposes of this course you should understand that price reverses direction when there is a dramatic change in
11:00
Speaker A
supply or demand another way of thinking about this is that the greater the shift in the supply and demand curves the greater the response and price obviously we cannot see the supply and demand curves of a market so we need to perform an analysis to
11:15
Speaker A
infer what's happening with the curves for that we need to align the law of supply and demand with the basic premise of technical analysis in price action reading which is that past price information can be used to project future market
11:27
Speaker A
direction meaning that we can forecast the near future using the recent past all of that is based on the idea that the market has some sort of memory and it reacts to past events in a predictable way that means there are places in the chart
11:42
Speaker A
that we can identify supply and demand changes that might be able to help us in the future the premise of using supply and demand in price charts is that the market will somehow remember the last supply and demand changes
11:55
Speaker A
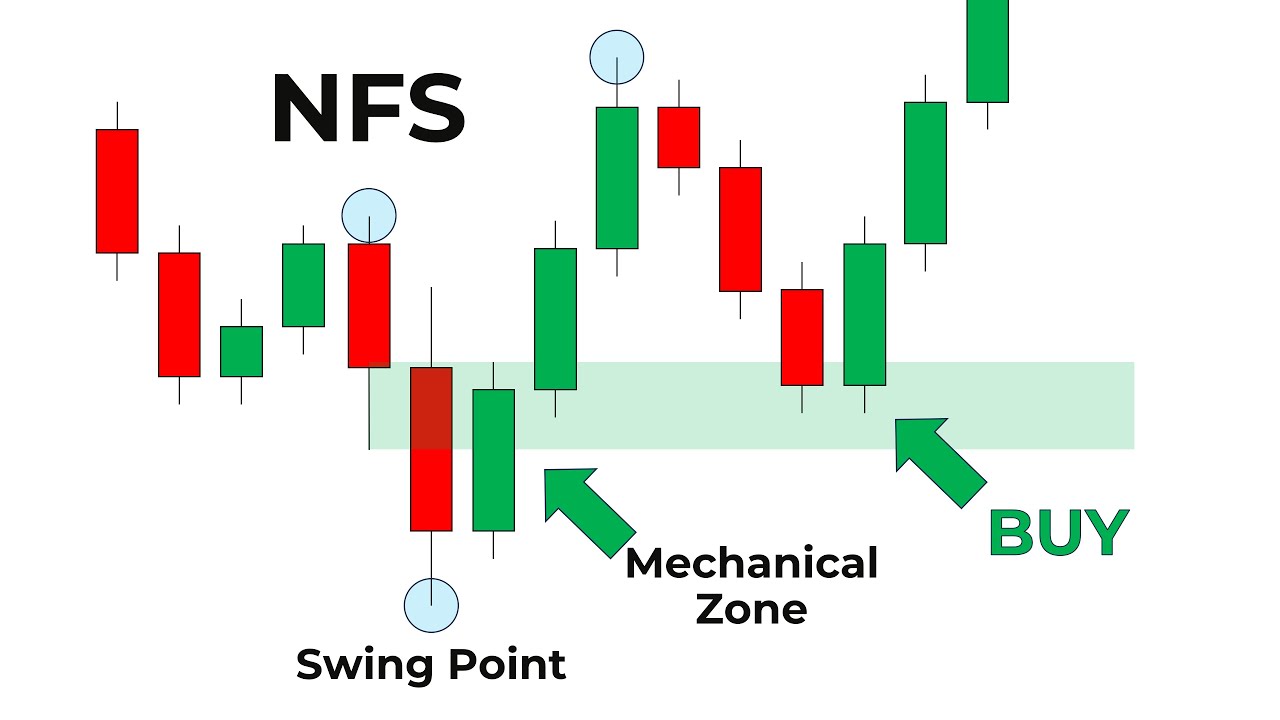
and it will react to these levels in the same way it did in the past if price comes back to it let's take a look at the demand zone example first this illustration you can see price going up the load that is formed between
12:08
Speaker A
two highs is where the demand zone will be in other words a demand zone will be near a low by extending this zone into the future and accounting of the basic premise of price action we can count on the fact that if price
12:21
Speaker A
comes back there the same buyers that made price rise the last time will do it again the low out of which the demand zone comes is a place where the demand curve has suffered a tremendous shift to the
12:32
Speaker A
right so now the market will seek the new equilibrium by producing a movement up the supply curve that's what makes price go up another important point here is that supply and demand zones are stronger when the movement right after the zone
12:47
Speaker A
produces a confirmation about the intent of the market player that produced the zone in the first place for example in this illustration we can see that after the demand zone buyers were able to create a higher high and that means these buyers still have
13:01
Speaker A
enough momentum to be trusted in the future if these buyers were not able to create the higher high it would be more dangerous to trust their demand zone in the future because of a lack of bullish momentum let's summarize a few guidelines about
13:15
Speaker A
the demand zone the low between two highs is where a significant demand shift happened the market will seek a new equilibrium by producing a movement up the supply curve price will rise as a result of this movement up the supply
13:30
Speaker A
curve the main zone will form in the low between two highs the second high must be higher than the first one for the demand zone to be strong we can extend this zone horizontally to project the next possible significant
13:43
Speaker A
low let's now look at the supply zone example in this illustration you can see price going down the height that is formed between two lows is where the supply zone will be in other words a supply zone will be near a high
13:59
Speaker A
by extending this zone into the future and counting on the basic premise of price action we can count on the fact that if price comes back there the same sellers that made price fall the last time will do it
14:10
Speaker A
again the height out of which the supply zone comes is a place where the supply curve has suffered a tremendous shift to the right so now the market will seek the new equilibrium by producing a movement down the demand
14:22
Speaker A
curve that's what makes price go down another important point here is that supply and demand zones are stronger when the movement right after the zone produces a confirmation about the intent of the market player that produced the zone in
14:35
Speaker A
the first place for example this illustration we can see that after the supply zone sellers were able to create a lower low that means the sellers still have enough momentum to be trusted in the future if these sellers were not able to create
14:50
Speaker A
the lower low it would be more dangerous to trust their supply zone in the future because of a lack of bearish momentum let's summarize a few guidelines about the supply zone the height between two lows is where a significant supply
15:03
Speaker A
shift happened the market will seek a new equilibrium by producing a movement down the demand curve price will fall as a result of this movement down the demand curve a supply zone will form in the high between the two lows
15:18
Speaker A
the second low must be lower than the first one for the supply zone to be strong we can extend this zone horizontally to project the next possible significant high in summary we know that a demand zone happens in the low between
15:31
Speaker A
two highs where the second high is higher than the first one and a supply zone happens in the high between two lows where the second low is lower than the first one knowing where zones are roughly located is one thing knowing exactly how to draw
15:46
Speaker A
them is another so next we are going to establish some rules and guidelines to draw the supply and demand zones since we are talking about a zone we need to establish two lines since our zone is formed by the space
15:58
Speaker A
between these two lines one of these lines is easier to establish and the other depends on each market scenario unfortunately let's begin first with the demand zone in a demand zone the easier line to draw is the lower one
16:12
Speaker A
all you need to do to be safe while drawing this line is following the absolute low in between the two highs in question in theory the next possible significant low can retrace all the way down to the slow out of which the zone
16:25
Speaker A
comes the difficult line to draw in a demand zone is the upper one because it depends on each individual market situation the rule for this upper line is that you need to identify a level where buyers really decided to bring
16:38
Speaker A
price up but it needs to be a different level than the absolute low so that's already being used for the lower line of the zone we'll observe some examples of this in just a moment in a supply zone the
16:49
Speaker A
easier line to draw is the upper one all you need to do to be safe while drawing this line is following the absolute high in between the two lows in question in theory the next possible significant high can retrace all the way up to this
17:03
Speaker A
high out of which the zone comes the difficult line to draw in a supply zone is the lower one because it depends on each individual market situation the rule for this lower line is that you need to identify a level where sellers
17:15
Speaker A
really decided to bring price down but it needs to be a different level than the absolute high since that's already being used for the upper line of the zone basically you need to identify the absolute market extreme in a level that highlights an important
17:28
Speaker A
decision from the market players before we move on to the examples using real price charts let's quickly go through another important aspect of supply and demand zones which is the risk management property built in this technique by definition a supplier demand zone
17:44
Speaker A
will provide a logical place to put a stop loss order that is near the entry point that implies that we have a small and logical stop-loss order that has the protection of the market player in question with a good headroom for the take profit
17:57
Speaker A
target in summary supplier demand zones provide a small and logical stop-loss with a large potential take profit target which is an absolute necessity if you want to survive trading in the long term in other words using a risk reward ratio
18:11
Speaker A
of one two three or one to four with supply and demand zones will make sure you can make money even if you are wrong more than 50 percent of the time because it will take a few losses to
18:21
Speaker A
wipe out one profitable trade if you use a one to three risk reward ratio you can lose 75 percent of the time and still break even if you lose a 1 to 4 risk reward ratio you can lose a whopping 80 percent of
18:34
Speaker A
the time and still break even all that of course assumes that your stop-loss and risk is the same in all trades trading is not about achieving the highest win rate possible it's about having enough room to make mistakes and still make money let's now
18:50
Speaker A
move on to practical examples as it will become much clearer what supply and demand zones are all about i should tell you first that supply and demand zones work in all time frames in all markets so you don't have to
19:01
Speaker A
worry about that as i said before the mechanism of supply and demand is something that underlies all markets in this first example we'll analyze the demand zone notice that we have two highs where the second is higher than the first
19:16
Speaker A
so the low in between is where the demand zone is as i said before finding the lower line of the demand zone is simpler since you can always go to the lowest point of the low in between the two highs
19:28
Speaker A
the more difficult part of the demand zone is finding out where the upper line of the zone is to find this line we must ask ourselves where did the buyers really decided to bring the market up after the lowest point of the low in
19:41
Speaker A
between the two highs if you look carefully there's an increase in volatility right after the lowest point this increase in volatility is highlighted by a larger bullish candlestick the point of origin of this candlestick meaning its opening value
19:56
Speaker A
is where the buyers from this demand zone really decided to bring the market up so in this case we can assign the upper line of our demand zone to the opening of this candlestick if price retraces back to
20:08
Speaker A
the demand zone we have an opportunity to go along in this market with a stop below the low in between the two highs and a target that is three to four times as large as the stop as we discussed earlier the last
20:20
Speaker A
fast-forward price to observe the changes in price action in this very kindle we can see evidence of our demand zone working properly notice that as soon as price touches the demand zone it immediately reacts to it by creating a large lower tail
20:42
Speaker A
or lower shadow in the respective candlestick that is a sign of buying pressure which makes sense in prices entering at the man zone by the way if you want to learn more about candlestick patterns and their interpretation don't forget to check my free
20:57
Speaker A
candlestick patterns course in the youtube card as soon as you see the evidence that buyers are still hanging around the level of the demand zone you can think about an entry there are hundreds of different ways to enter in the markets so we cannot
21:10
Speaker A
explore them all in this video alone here's one advantage of using supply and demand zones since we are pretty close to the logical stop-loss level you can enter the trade in the very next scandal that's not always the case but in the
21:24
Speaker A
situation that we are analyzing right now it seems okay don't forget that the more precise you get in your entries the less risk you're going to take and the higher your risk reward will be which means you will increase your
21:37
Speaker A
margin of error dramatically that will propel you forward into long-term sustainability by fasting forward price we can see that the market would meander a little bit then it would start to go up using the demand zone as a cushion
21:51
Speaker A
and after that hitting the appropriate target the next example we are going to study is from a supply zone this might be a little trickier because it will involve other highs and lows in the middle but if you adhere to the rules i already
22:07
Speaker A
established it should be easy to filter out the noise and concentrate on the details that really matter the first thing to notice here is that we have two loads highlighted the second low is lower than the first one so a supply zone will come out of
22:21
Speaker A
the high in the middle of these laws now we need to move on to the upper and lower limits of the supply zone in the case of supply zone the upper boundary is easier to draw because we can simply count on the highest point
22:35
Speaker A
of the high in the middle of the two loads we highlighted before part about a supply zone is determining its lower limit or lower boundary that's because we need to find a place after the high where sellers really
22:48
Speaker A
decided to bring the market down needless to say this will vary a lot depending on the market scenario you are analyzing that's why it's difficult to come up with one single rule that works every single time for all cases
23:01
Speaker A
this example is actually similar to the previous example where we examined a demand zone right after the high we can see that there is an explosion of volatility to the downside this is where sellers really decided to bring the market down so we can use this
23:16
Speaker A
as the lower boundary of our supply zone there are other more advanced techniques that will point to different levels that can be used here but i'm not going to go into detail about those since this is a beginner's guide i'm
23:29
Speaker A
just showing you the basics in here the supply zone represents a range of price where strong sellers are likely to be at if price returns to this level there might be grounds for a short trade depending on what price does
23:42
Speaker A
if it reaches the zone let's advance price to see what happens at this point we can identify a few different things in here in the micro level we can see that candlestick spears the lower boundary of our supply zone
24:04
Speaker A
and judging by the pronounced upper tail in this candlestick we can see that there is some selling pressure in the zone still so far this is great evidence for a short trading here since the current price action agrees with the supply zone in a broader
24:17
Speaker A
sense however the situation might not be so clear observe that by the time price retraces to the supply zone buyers just got a new demand zone proven that is of course evidence for bullish strength i want to point this out to you because
24:31
Speaker A
there will be many times where you will find yourself in a situation like this then you will have to make a judgment call based on which market player is stronger and which one has more room to travel at
24:43
Speaker A
the moment this is also a more advanced subject but i thought it would be a good idea to point it out to you despite all of that we are at a supply zone with a very good stop-loss level
24:54
Speaker A
above the highest high in the chart and plenty of room for price to travel enough to use at least a one to three risk reward ratio if price goes back down there the target will be more or less
25:05
Speaker A
where the newly created demand zone is so let's advance price to observe what happens you can clearly see here that sellers indeed show up again and supported the short trade these two examples highlight how supply and demand zones work in
25:31
Speaker A
optimal scenarios however in real life things are not so pretty because of that i decided to show you a couple of more examples of what happens when supply and demand zones fail perhaps more importantly than knowing what to do when this technique works
25:46
Speaker A
is knowing what to do when it doesn't work it's not difficult to find examples of failed supply and demand zones we don't even have to change the chart for that let's use the example of the demand zone we identified in the
25:59
Speaker A
previous example we have the low in between two highs where the second height is higher than the first one so at least in theory we are dealing with a strong demand zone to draw the lower boundary of the demand
26:11
Speaker A
zone we can simply go to the lowest point of the low in between the two highs and once again the upper boundary can be determined by the shift in volatility that happens right after the low let me remind you once again that this
26:23
Speaker A
is not always the case there are many more examples of market scenarios where it's really difficult to pinpoint one of the boundaries of the zone we can already see that this demand zone clearly failed there are clues you can spot to help you
26:37
Speaker A
identify that in real time the most important thing you can do is to watch what price does as it reaches the zone notice that in this case price simply ignored the existence of the demand zone as price touches the upper and lower
26:51
Speaker A
boundaries of the zone there is no evidence of bullish pressure of any kind on the contrary there is only evidence of bearish pressure it is as if the demand zone wasn't even there in the first place however even if you ignore this fact and
27:06
Speaker A
you took a long trade there the stop loss would still be pretty small and the damage would not be so big this is once again one of the great things about the supply and demand zone technique it gives you a logical and small
27:19
Speaker A
stop-loss order placement notice that if you took the previous short trade in the example about the supply zone it also took the long trade your total p l will be positive because the target of your trades are a
27:32
Speaker A
few times larger than the risk so it takes a few batteries to wipe out the profit from one good trade let's now look at one last example where a supply zone fails at this point you should be identifying
27:46
Speaker A
the basic elements of a supply zone more quickly we can see the two lows where the second is lower than the first and we can see the upper boundary of the zone marked by the absolute high and the lower boundary of the zone
27:58
Speaker A
highlighted by the increase in volatility to the downside after the absolute high it's interesting to notice how price comes back to the level where volatility increased and starts to go down again from that point it's an indication that this is
28:12
Speaker A
indeed a good place to put the lower boundary of the supply zone let's advance price to see what happens at this point you can look at this and think that price is touching the lower boundary of the supply zone
28:35
Speaker A
and showing a little bit of selling pressure by the way the upper tail or upper shadow of that candlestick looks for all intents and purposes that is a correct assumption so you could in theory go ahead and place a
28:47
Speaker A
short trade with a stop above the height that originated the supply zone in the first place with a target that is three or four times as large as we have been discussing throughout the course let's advance price to see what happens
29:15
Speaker A
here we can see that despite this being a perfectly valid trade you would have been stopped out at this point you will start asking yourself what you did wrong and you can also start to rationalize why you shouldn't take this trade
29:29
Speaker A
this is a slippery slope and i want to grab your attention to why this sort of thing happens traders need to understand that technical analysis and price action analysis are not exact sciences there are many different types of market
29:42
Speaker A
participants acting for different reasons that means that there is no such thing as a technique that works all the time and as i just said sometimes you will do everything correctly and the trade will still fail if that
29:55
Speaker A
wasn't the case we would not be talking about speculation anymore no matter how good your technique is in trading you are always speculating and taking a chance at the end the way we have to counteract this uncertainty of trading is by using good
30:09
Speaker A
risk management guidelines this is precisely the reason why you need to use a risk reward ratio that allows you to be wrong most of the time and still make money in the end in the long term your profits will be
30:22
Speaker A
bigger than your losses and you will make money so sometimes you will be let down by a trade that looked promising and ended up failing in others you will beat yourself up because you didn't take the trade that looked sketchy and it
30:34
Speaker A
ended up working that's natural in trading to sum things up the supply and demand technique is one of the most reliable trading techniques for two main reasons first is a technique based on an actual principle of economics that happens to
30:50
Speaker A
be a widely used and respected across multiple schools of economic thought the second reason is that supply and demand technique has no lag unlike many of the trading techniques you see out there it's definitely a good tool to have
31:03
Speaker A
under your belt as a trader this concludes this free video course about supply and demand technique if you like the course and you wish that i continue to create quality educational content for free please consider hitting the like button
31:17
Speaker A
subscribing to the channel activating the notifications button sharing the video and leaving your comment below if you want to take your training to the next level and learn many more techniques strategies and methodologies please visit my official website
31:32
Speaker A
fractalflowpro.com in the youtube card or in the link available in the video description and check out my paid courses as well that's it for this video i really hope you learned something new and useful so thank you very much for watching and
31:46
Speaker A
i hope to see you in the next videos take care you
Topics:supply and demandtrading strategiesmarket equilibriumprice actiontechnical analysisfinancial marketslaw of demandlaw of supplyFractal Flowbeginner trading guide

Frequently Asked Questions

What is the law of demand in trading?

The law of demand states that as the price of an item increases, the quantity demanded by buyers decreases. This principle helps traders understand buyer behavior in the market.

How does market equilibrium affect price stability?

Market equilibrium occurs when the quantity buyers want to purchase equals the quantity sellers want to sell, causing prices to stabilize because there is no motivation to change buying or selling behavior.

Why do prices change if markets seek equilibrium?

Prices change due to shifts in supply and demand curves caused by changes in buyer and seller perceptions, motivations, or external factors, prompting the market to seek a new equilibrium.

Get More with the Söz AI App

Transcribe recordings, audio files, and YouTube videos — with AI summaries, speaker detection, and unlimited transcriptions.

Or transcribe another YouTube video here →