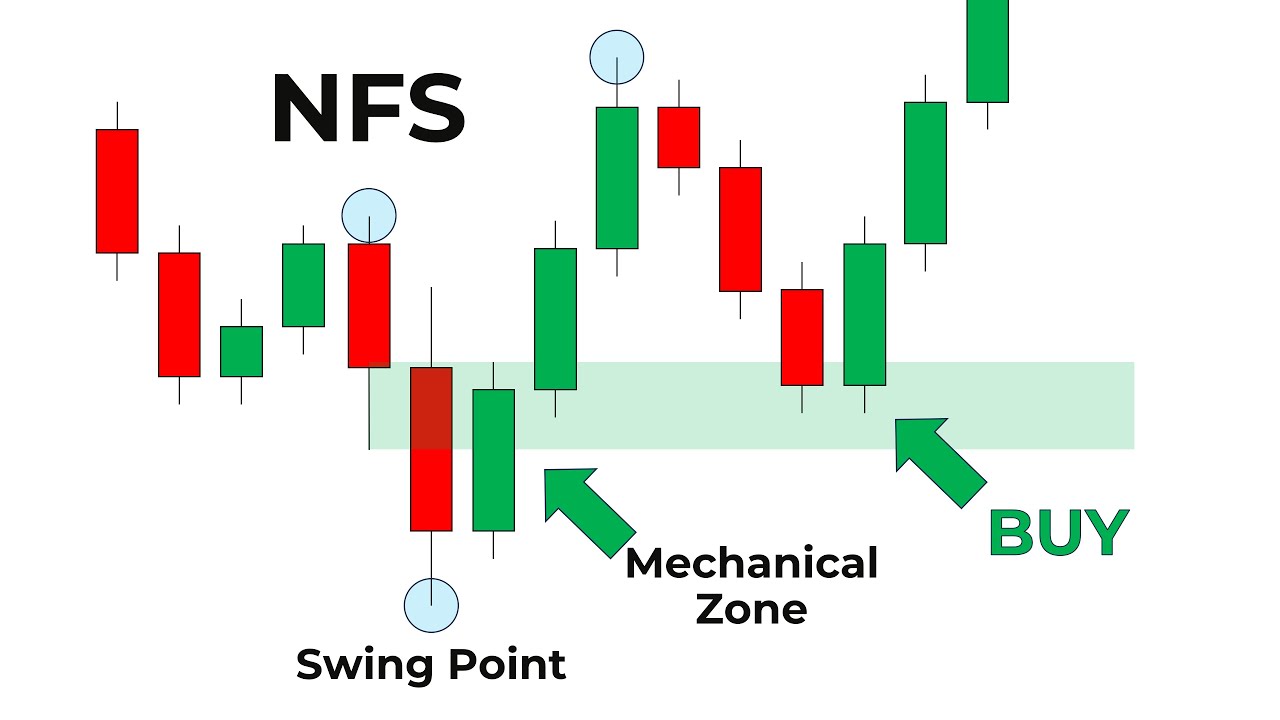
20 Ways of CATCHING A PULLBACK — Transcript

Learn 20 effective techniques to catch pullbacks in trending markets using price action, volume profile, VWAP, and advanced tools like Pitchforks.

Key Takeaways

  • Trading pullbacks aligns you with the trend, reducing risk compared to picking tops or bottoms.
  • Combining price action with volume and volatility indicators improves pullback entry accuracy.
  • Advanced tools like Pitchforks and anchored VWAP reveal hidden support and resistance levels.
  • Confirming price reaction patterns like inside candles or fractal candles increases trade reliability.
  • Volume profile and gap analysis provide logical stop-loss and entry points.

Summary

  • Catching pullbacks is a strategy to trade with the trend, easier than picking tops or bottoms.
  • Technique 1: Support and resistance switch identifies trend resumption points.
  • Technique 2: Double Pitchfork uses alternating highs and lows to find precise turning points.
  • Technique 3: Return to volatility shift highlights price retracements to high volatility levels.
  • Technique 4: Point of control from volume profile shows key support/resistance levels.
  • Technique 5: Return to runaway gap exploits gaps in trending markets like stocks.
  • Technique 6: Anchored VWAP provides dynamic support/resistance based on volume-weighted average price.
  • Technique 7: Continuation divergence signal helps trade with the trend rather than reversal.
  • The video includes practical examples and encourages confirming price reactions before entering trades.
  • Additional resources include playlists on price action patterns and trend reversal anticipation.

Full Transcript — Download SRT & Markdown

00:00
Speaker A
In today's video, I'm going to quickly demonstrate 20 ways of catching a pullback. The reason it's useful to learn this is because catching a pullback is a way of trading with the trend, which is easier than simply trying to pick tops
00:14
Speaker A
or bottoms. So, without further ado, let's begin. The first technique for catching a pullback is to observe a simple support and resistance switch. This is extremely simple to observe. In this case, we are in an uptrend and we see price forming a high and
00:32
Speaker A
then retracing a little bit. This high can be used as a place to anchor a resistance line. After that, we observe price zooming past the resistance line to the upside. This is the characteristic switch of support and resistance lines. In this
00:47
Speaker A
case, the line should act as support. Now, a few candles later, we see price retracing to the support line. Once price touches the line, it forms an inside candle and it decreases volatility, indicating that it will resume the overall trend direction to
01:03
Speaker A
the upside. You can apply the same principle in a downtrend by using the opposite logic. As you can see here, this simple technique was able to pinpoint the exact moment where the uptrend resumed, leading to a significant price
01:18
Speaker A
movement. The second technique for catching a pullback is called double Pitchfork. This is a little bit more advanced, but it provides an incredibly precise way of seeing turning points. Notice here that price has made a new high and started to retrace to the
01:34
Speaker A
downside. It's at this point that you will employ the double Pitchfork technique. To ground the first Pitchfork, we need three alternating highs and lows. Since we are trying to catch a low, we are going to use a high, a low, and a high
01:47
Speaker A
to draw the first fork like so. The idea here is that price will exhaust its energy at the center line. The second fork will be drawn using the exact same anchoring points of the first fork, but we are going to change
02:02
Speaker A
this fork to a modified shift one. The modified shift fork simply brings the A axis of the fork to the midpoint of the AB segments, providing a different angle to the original Pitchfork. Once we see the market evolving, we can notice an
02:17
Speaker A
interesting effect. Price seems to respect the down-sloping line of the first fork and eventually it hits the center line of the down-sloping fork and the lower up-sloping line of the modified shift Pitchfork at the same
02:30
Speaker A
time. Notice also how the candle that does that demonstrates a clear reaction to both lines. From that point on, price reverses to the upside. As we can see, Pitchforks are an extremely interesting technique because they are able to
02:45
Speaker A
unveil lines and angles that are not obvious in the price chart. The third technique for catching a pullback is called return to volatility shift. In this case, we'll observe an example of a downtrend. Notice how price has been making lower highs and lower
03:01
Speaker A
lows. Pay attention to the second price movement down. Notice that in the beginning, volatility is very low and price doesn't advance too much to the downside. After a few candles, we see that volatility shifts and price goes to the
03:16
Speaker A
downside with more violence. This is called a volatility shift. Often, price will return to this level because it's the level where sellers indeed won against buyers. In this particular price movement, we marked the volatility shift with the line at the open of the high
03:33
Speaker A
volatility candle. Moving price into the future, we can see that it eventually retraces back to that level. Notice how price seems to find a strong resistance at that level, testing it a total of five times without being able to break it to
03:48
Speaker A
the upside. Eventually, the buyers trying to break that resistance give up, and the sellers that created the volatility shift to the downside resume control again, and price begins to move to the downside as expected. One nice thing about this is
04:04
Speaker A
that the previous high provides a very good logical stop-loss location for a short trade. Technique number four is the point of control in the volume profile tool. The volume profile shows the level of trading activity in various price
04:19
Speaker A
levels in a range determined by the trader. This is a lot easier to understand with an example. In this chart, we see price creating a significant movement to the upside and then starting to retrace to the downside. At this point,
04:34
Speaker A
you can use the fixed range volume profile and plot it from the beginning of the upward price movements to the end of the price movement. The volume profile will plot a histogram showing the price levels that have been traded the most in
04:47
Speaker A
that upward price movement. The red line you see is called point of control, and it simply represents the price level with the highest level of activity in that selected range. The market often sees these levels as important support
05:01
Speaker A
and resistance levels. Moving price into the future, we can see how the market approaches the point of control established by the volume profile and reverses to the upside as soon as it touches it. Notice also that the second
05:14
Speaker A
candle that reacts to the point of control is a bullish fractal candle. Technique number five for catching a pullback is called return to the runaway gap. This method provides more opportunities in markets that have more gaps, like stocks, for example. In this
05:31
Speaker A
chart, we can see how we have an uptrend and right here we have what's called a runaway gap, which is simply a gap in favor of the trend. It's common for price to return to the gap, create some sort of
05:44
Speaker A
reaction, and continue to move in the overall trend direction. If we move into the future here, we'll see that price retraces back to the gap area, fails to close within the gap, and then produces an inside candle, indicating that it has
05:57
Speaker A
found support at the upper limit of the gap. This is an indication that price will resume its main direction, which is the upside in this case. Notice how it's always important to observe how price reacts in these important price levels
06:11
Speaker A
to confirm the technique. Since we have an inside candle here, the classic trigger is to wait for price to break the high of the inside candle to get in a long trade. As we can see here, price starts to move to the upside after the
06:25
Speaker A
breakout of the inside candle. I made a video explaining 20 fast price action patterns such as the runaway gap. You can check that out in the video card. In fact, I have made a playlist called Technical Analysis Vault, where there is also a
06:39
Speaker A
video called 16 ways of anticipating a trend reversal. I will leave the links in the description and video cards. Technique number six for catching a pullback is the anchored VWAP. In this chart, we can see that the price has
06:54
Speaker A
made a significant price movement to the upside and it's now retracing. At this point, you can anchor a VWAP indicator at the low that originated the upward price movement. The important part here is to anchor the indicator in a price extreme
07:09
Speaker A
that makes sense in the overall analysis. The indicator will plot a main line that shows the average price the market has traded based on both volume and price, with the added benefit of being plotted in a logical price point, unlike
07:23
Speaker A
Bollinger Bands, which move in a rolling window of calculation. The anchored VWAP can be grounded on price points that make more sense, therefore providing more accurate reversal points. As we move into the future, we can see that price
07:37
Speaker A
retraces back to the VWAP line, creates a fractal candle, and then it starts to go up again and it never comes back. It's not uncommon for the anchored VWAP indicator to provide extremely good levels of dynamic support and resistance,
07:51
Speaker A
like this. Technique number seven is the continuation divergence signal. Most traders look for the more famous reversal divergence signal, but the problem with that is that the reversal divergence signal is usually an attempt to catch a top or bottom, which is a lot
08:09
Speaker A
harder than trading with the trend. The continuation divergence signal is a way to take advantage of the power of divergence while trading with the trend. In the case of an uptrend, like we can see here, the continuation divergence
08:22
Speaker A
signal occurs when...
08:39
Speaker A
the RSI you can see it in many other indicators like the macd the stochastic the rate of change the money flow index and so on notice in this example how the RSI is already making a lower low while price
08:53
Speaker A
action is making a higher low with Divergent signals like this it's always important to detect support and resist resistance levels that correlate with the signal here we can see that price stops at a previous support and then creates
09:06
Speaker A
an inside candle right after a powerful movement to the downside that's a perfect setting for a continuation to the upside price action and momentum are diverging and price has just encountered a support right after that we can indeed
09:22
Speaker A
see that price continues to the upside resuming the overall uptrend this is perhaps one of the most reliable combination of techniques you can use and it's extremely simple technique number eight is the simple trend line at the beginning of a
09:38
Speaker A
trend whenever price action starts to Trend we can usually spot a specific angle in the first highs and lows like so it's not uncommon to see this angle being respected for the rest of the trend in different ways in this example
09:53
Speaker A
we can see that price action comes back to this simple trend line and it ends up creating a reaction to it judging by the look of the lower shadow of the candle that touches the line if we advance
10:04
Speaker A
price to the future we can see that it comes back to test this trend line a couple of times which would yield additional trade entries then price goes to the upside a little bit more before coming back to the line once again to
10:16
Speaker A
touch it a couple more times the candles that touch the line produce a reaction to it which is the signal you need to trust the line in real time right after that we can see that price starts to
10:28
Speaker A
move significantly to the upside side notice how a simple trend line can sometimes Ute an incredibly accurate point of entry technique number nine is the FIB cluster there are many ways to use Fibonacci clusters just in terms of
10:44
Speaker A
price we can use Fibonacci extensions expansions retracements and projections but I will leave the difference between the four for the Fibonacci training guide I'm preparing in this example we'll observe the combination of a fib retracement in a fib
11:00
Speaker A
projection whenever you see price action starting to retrace like we can see here the immediate reaction of a lot of Traders is to pull up the FIB retracement tool however not all Traders look at the same price movements when
11:13
Speaker A
doing that some Traders look at larger movements and other Traders look at smaller movements for instance the Fibonacci retracement is plotted here on a larger price movements however there are Traders looking for smaller movements going to the downside like
11:29
Speaker A
this one these Traders will be looking for Fibonacci projections like so the trick with Fibonacci clusters is to see where the FIB levels of different FIB tools correlate and then to observe what price does when it reaches these clusters for
11:46
Speaker A
example here we can see how the 50% retracement level correlates with the 161.8% projection and also how the 61.8% retracement level correlates with the 200% projection level as price begins to approach these levels the trader must pay close attention to how price
12:06
Speaker A
interacts with them since this is the main way of telling which one of these levels will indeed serve as support in this case notice that in the first FIB cluster price simply zooms to the downside it creates no reaction at all
12:20
Speaker A
so it can obviously discard it as a significant support in the lower cluster however price does react look at how the candle that touches the cluster produces a larger lower Shadow and then right after an inside candle appears showing
12:35
Speaker A
that price has stopped advancing and might reverse due to the current FIB cluster acting as support this is an example of how the FIB cluster technique can take advantage of the self-fulfilling prophecy effect built into the Fibonacci trading methods
12:50
Speaker A
but it does that by integrating distinct crowds of FIB Traders as we can see here price indeed reverses significantly to the upside after the the fif cluster technique number 10 is the ABC channel this is a very simple technique
13:08
Speaker A
also in order to project a low we need the angle between two highs and then we duplicate this angle to the low in between these highs if we were looking to project a high we would need the angle between two lows and then we would
13:21
Speaker A
duplicate this angle to the high in between the lows in this example we are trying to project a low assuming that this is the beginning of a up Trend it's common for retracements to follow an ABC pattern or a three-wave pattern before
13:36
Speaker A
the trend resumes once we have two established highs and we see price going to the downside we can begin to draw the lines that will project the ABC channel in this case we are going to project the low so we need a line that connects
13:50
Speaker A
these two highs and then we duplicate the same angle to the low in between the highs that gives a reference point for the retracement to end moving price into the future we can see that price indeed stops there in a way that suggests that
14:04
Speaker A
such a line is indeed a support for the students of my methods you can spot a fractal candle reacting to the line which is always good news after price hits the lower line of the channel we can see that the uptrend
14:17
Speaker A
resumes even though the ABC channel technique is incredibly simple it can yield very powerful and precise results technique number 11 is called steep moving average reaction there are two key components in this technique the angle of the moving
14:35
Speaker A
average and the kind of price reaction to the moving average moving averages tend to provide strong levels of dynamic support and resistance only when they have a steep angle to identify a pullback using this technique the trader must first detect that the moving
14:52
Speaker A
average has a steep angle the steeper the angle the better after that the trader must wait for price to intera act with the moving average and more importantly to observe price making some sort of reaction to it indicating that
15:06
Speaker A
it will respect the moving average as a dynamic support or resistance level in this case we can see a steep Ma and price retracing and interacting with it notice that as soon as price hits the ma it produces candles with prominent lower
15:21
Speaker A
shadows and eventually an outside candle that gives the impression that the market will indeed bounce off the ma which is exactly what what happens after as we can see here the cue to enter the trade is when you see an obvious reaction like
15:39
Speaker A
this technique number 12 is not very common which is exactly why you should learn it the technique is called time cycle and it's based on the assumption that the market follows predictable temporal Cycles which of course helps to
15:53
Speaker A
discover the timing of reversals which is always a problem to use this technique we measure the time it took for the market to produce a price movement using the cyclic lines tool in trading view an upper price movement in
16:06
Speaker A
this case that will generate a projection for the future based on the time it took to form the current price movement assuming that major reversals will occur following the same time if we move forward we can see that there are a
16:20
Speaker A
lot of places where price can reverse based on what happened in the previous price movement against which price is retracing but price doesn't reverse significantly until it completes 100% of the time cycle of the previous movement as is the case with any trading
16:35
Speaker A
technique this should be used with other tools in this case it's a good idea to combine this timing tool with some sort of price ratio like Fibonacci ratios in a phase analysis tool like Elliot wave theory for example another possibility
16:50
Speaker A
is to combine the time cycle technique with an obvious support and resistance level like we can see right here technique number 13 is called sloped support and resistance this consists in connecting highs and lows in the chart in such a
17:07
Speaker A
way that create slope lines that have acted as support and resistance in the chart for example in this chart we can connect this high with this low notice how this line acts as a previous resistance then price breaks it to the
17:21
Speaker A
upside and then it comes back to tested as support this technique is interesting because it shows support and resistance levels that fewer people can see which might provide an additional Edge to the traders that do see them eventually
17:35
Speaker A
price does come back to this line to test it again it cannot be stressed enough how important it is to observe how price reacts when it meets the line in this case you can see that there is a
17:46
Speaker A
small burst of volatility to the upside with this candle this is the clue you need to trust this line at this moment moving price into the future we can see that price indeed went to the upside right after this is one simple example
18:00
Speaker A
of the underlying geometry that exists in price section which not a lot of people can see most people can only see the obvious support and resistance lines which is good but if you can spot these less obvious lines you will put yourself
18:13
Speaker A
in a advantageous position in relation to most Traders technique number 14 is the supply and demand line from the expanding pivot formation an expanding pivot formation is simply when a higher high is followed by a lower low or vice versa in this
18:31
Speaker A
example we have a lower low followed by a higher high notice that this means that sellers were led to the downside but then buyers disproved them by creating a higher high the level that represents the moment where sellers
18:44
Speaker A
thought they had made a significant lower low is remembered especially by the sellers who thought they had a good trade at the time these sellers remember that and now they change their bias meaning that they are now buyers ready
18:57
Speaker A
to compensate for their losses notice that as price reaches that level again it produces a reaction indicating that those sellers who are now buyers indeed remember what happened to them in the recent past notice also how price comes back a second time to give an
19:13
Speaker A
opportunity to the buyers who didn't trust the first one after that we can see price moving significantly to the upside as a result from the h sellers who transformed into buyers technique number 15 is called the initial Trend angle
19:29
Speaker A
this technique is similar to the previous one in the sense that we can usually spot an expanding pivot nearby when a new trend begins after an expanding pivot price will often create smaller extremes at the beginning that can indicate what the overall angle of
19:45
Speaker A
the trend will be in this example we can see price returning to that initial Trend angle and reacting to it with a very clear fractal candle which also happens to be a high volatility Hammer pattern for those who like candlestick
19:59
Speaker A
patterns after that we see price resuming to the upside notice once again how the reaction to the line is the recurring theme Here There are all sorts of different lines that can be logically drawn in the chart the way to filter the
20:13
Speaker A
good ones from the bad ones is to observe how price reacts when it meets such lines that is by far the most important aspect of this technique number 16 is an extension of the previous initial Trend angle technique in away and it relates to the
20:31
Speaker A
geometry of Trends We Begin by first identifying the initial Trend angle and then we duplicate the same angle to other Market extremes that happened right after in this case we can clearly see price producing a UPS sloping angle at the
20:46
Speaker A
beginning of the uptrend after that we can duplicate this line to a subsequent low expecting that price will return to the second line and produce a reaction from it moving price action into the future we see that price
21:00
Speaker A
does return to the second UPS sloping line and produces an obvious reaction to it judging by The prominent lower Shadows of the candles that interact with the line we can once again see a fractal candle in there if we advance
21:14
Speaker A
the market into the future we can see how such line indeed pointed to an accurate Turning Point notice how an angle that was discovered at the beginning of the trend continues to be respected further down the road which is indication that price
21:27
Speaker A
indeed hides a certain kind of geometry that is not obvious to most Traders technique number 17 is called return to minor consolidation price doesn't reverse only in obvious places or significant price levels it's not uncommon to see price
21:45
Speaker A
reversing at Price levels that represent subtle events this is the case of price reversing at minor consolidations in this chart we can see price starting to retrace after a powerful move to the upside notice that we have a small consolidation here
22:01
Speaker A
meaning a series of low volatility candles moving sideways these levels tend to represent support and resistance zones for price on a lower time frame the small consolidation would probably be considered a significant one that's why price can reverse in apparently
22:17
Speaker A
insignificant price levels in the home time frame notice that as price returns to the area with fairly High volatility it stops there and produces an inside candle which is a classic sign that the market has stopped advancing the
22:32
Speaker A
breakout of the high of this inside candle is the trigger for a trade like this with a stop below the recently formed low as you can see here price indeed reverses at a small consolidation that doesn't always happen
22:45
Speaker A
of course price can simply Zoom through the levels of these small consolidations so once again we have to recall that the reaction to these levels is more important than the levels themselves technique number 18 is called super Trend reaction and it's based on the
23:03
Speaker A
super Trend indicator which is itself based on the ATR indicator this indicator provides a lower support in uptrends and a higher resistance in downtrends the trick here is to observe price reacting to these dynamic levels in an obvious way in this chart you can
23:21
Speaker A
see price returning to the dynamic support and creating several reactions without violating the support price eventually creates a candle that signifies more power from buyers and that's the queue you need to enter a long trade after price failed to
23:36
Speaker A
break the supertrend dynamic support going into the future we can indeed see that price went significantly to the upside right after the bullish certainty candle occurred after the several attempts to break the dynamic support technique number 19 consists in
23:54
Speaker A
confirming a bull or bear trap pattern with some sort of classic candle formation in this chart we can see that price retraced against an upward price movement all the way down to the low and then it produced a reaction to the
24:08
Speaker A
upside some Traders will correctly assume that this is a double bottom forming in real time but occasionally price will produce another small leg down to form a bear trap in this case which is the attempt to trigger sellers
24:21
Speaker A
to the downside just so that larger bullish orders can enter the market due to the increase in liquidity just below the significant l moving price into the future we can see that this is what happens price pokes the previous important lows and fails to
24:36
Speaker A
close below them which is a classic sign of Market manipulation beyond that price produces what's called a highwave pattern which is basically a high volatility version of the spinning bottom formation the breakout of the high of the high wave
24:51
Speaker A
pattern is the Q you need to enter a long trade here with a stop below the low of the bear trap moving into the future we can see how this was indeed a successful strategy in this particular Market
25:04
Speaker A
scenario the last technique consists in observing a reversal Divergence pattern occurring in the retracement instead of trying to pick a top or bottom and combining that with a simple support and resistance switch in this chart we can see a clear resistance line and price
25:21
Speaker A
coming back to it to test it as support moving price into the future we can see that the retracement is composed of minor highs and lows and the lower low that touches the support line happens with a bullish reversal Divergence
25:35
Speaker A
bullish reversal Divergence is when price makes lower lows while the oscillator makes higher lows indicating that the lower lows in price don't have enough momentum behind them the very touch of the support line is also a fractal candle in this case this is the
25:50
Speaker A
queue you need to enter a long trade moving price into the future we can see how the simple strategy was key in identifying the end of the pullback therefore the beginning of the next big upward price movement notice how
26:03
Speaker A
reversal Divergence signals are not necessarily used just in trying to pick tops or bottoms at the beginning or end of Trends they can be used to catch the end of a pullback so you can trade in favor of the trend also even though
26:17
Speaker A
there are a lot of good examples of how to catch pullbacks in this video price action is a lot broader than this there are dozens of specific Market situations like this if you wish to wonder understand how to map out and trade
26:30
Speaker A
several kinds of Market scenarios in any market and time frame check out my premium courses in a video description if you have any questions you can also send me an email at support fractal flowpro docomo flowpro docomo the ongoing creation of free
26:49
Speaker A
videos like this one please help support the channel by clicking the like button subscribing to the channel activating the notifications button leaving your feedback in the comment section and sharing this video with your trading Community it's a very small effort on
27:03
Speaker A
your part but it makes a world of difference for the channel don't forget also to check out my playlist called technical analysis Vault where I talk about different ways of seeing Trend reversals fast price action patterns and so on you can also check my other
27:18
Speaker A
playlist with free video courses about several training methods such as candlesticks chart patterns volume trading Dow Theory Elliot wave theory wo method moving averages and so on thank you very much for watching and I hope to see you in the next videos take care
Topics:pullback tradingprice actionsupport and resistancepitchfork tradingvolatility shiftvolume profileanchored VWAPtechnical analysistrend tradingfractals

Frequently Asked Questions

What is the main advantage of catching pullbacks compared to picking tops or bottoms?

Catching pullbacks allows traders to trade with the trend, which is generally easier and less risky than trying to predict market tops or bottoms.

How does the double Pitchfork technique help in catching pullbacks?

The double Pitchfork technique uses two overlapping Pitchforks with different angles to identify precise turning points where price is likely to reverse and resume the trend.

What role does the anchored VWAP play in pullback trading?

Anchored VWAP provides a volume-weighted average price level anchored to a significant price extreme, offering dynamic support or resistance levels that help identify potential reversal points.

Get More with the Söz AI App

Transcribe recordings, audio files, and YouTube videos — with AI summaries, speaker detection, and unlimited transcriptions.

Or transcribe another YouTube video here →